In-depth solid profiles interpretation
181 views
Skip to first unread message

RNstu08
Oct 6, 2022, 2:18:20 PM10/6/22
to FDS and Smokeview Discussions
Hello Everyone,
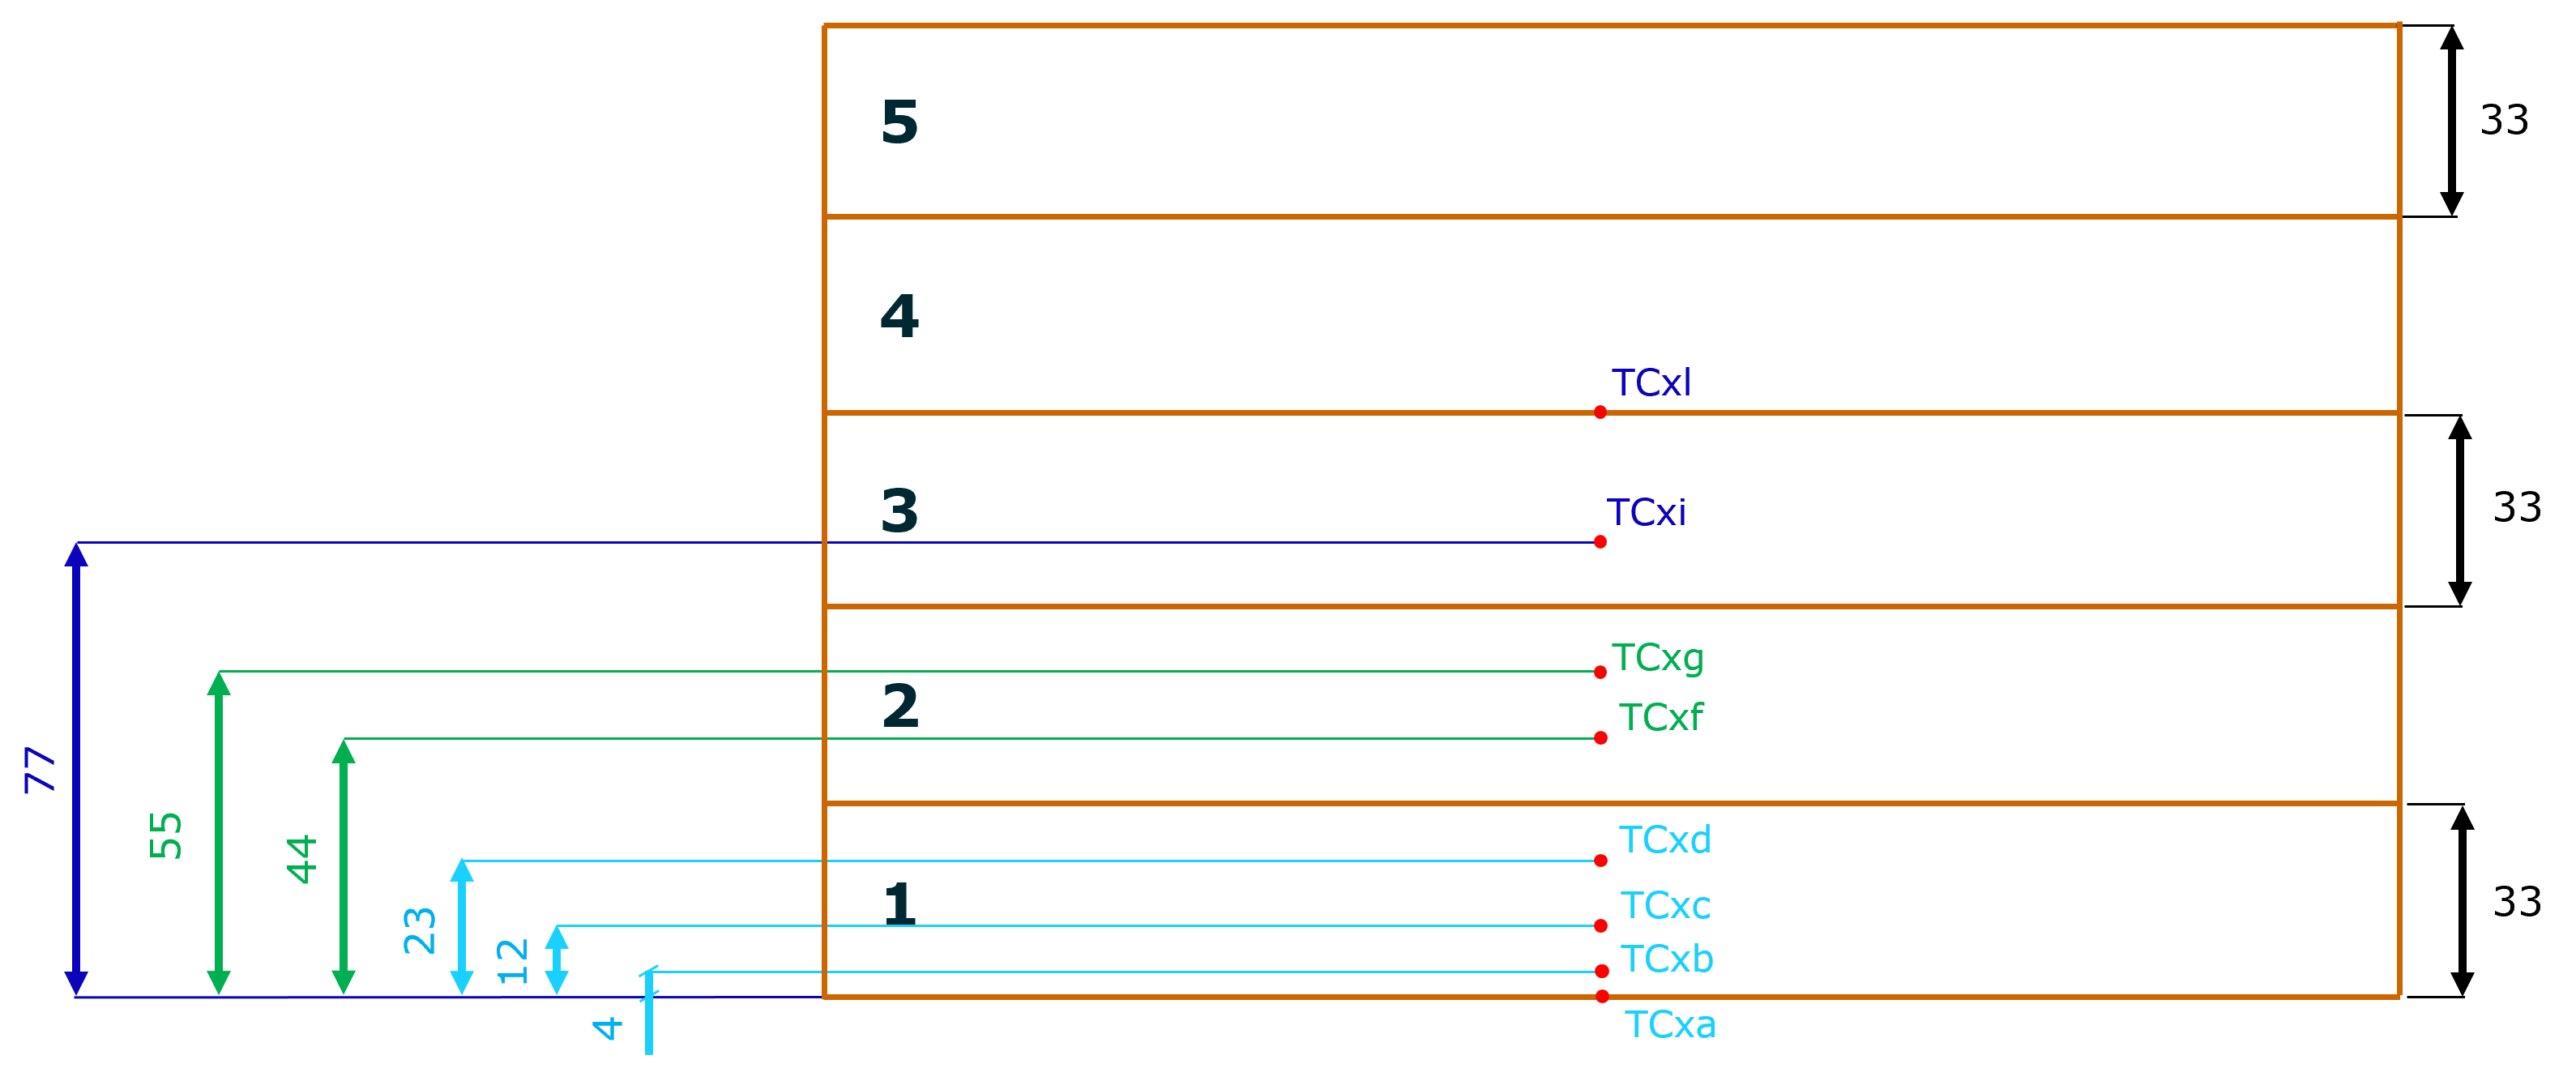
I am trying to find the temperatures inside the solid. As an example, I have created a sample case which has 5 layers of solids with each layer thickness of 33mm.
Thermocouples were placed inside each layer at several depths, as shown in the figure. The minimum dimensions between each TC's are 4mm, 11mm, and 12mm. Therefore, I chose 11 mm as a mesh size. I am trying to use the solid PROF option in two different ways to find the inside wall temperature.
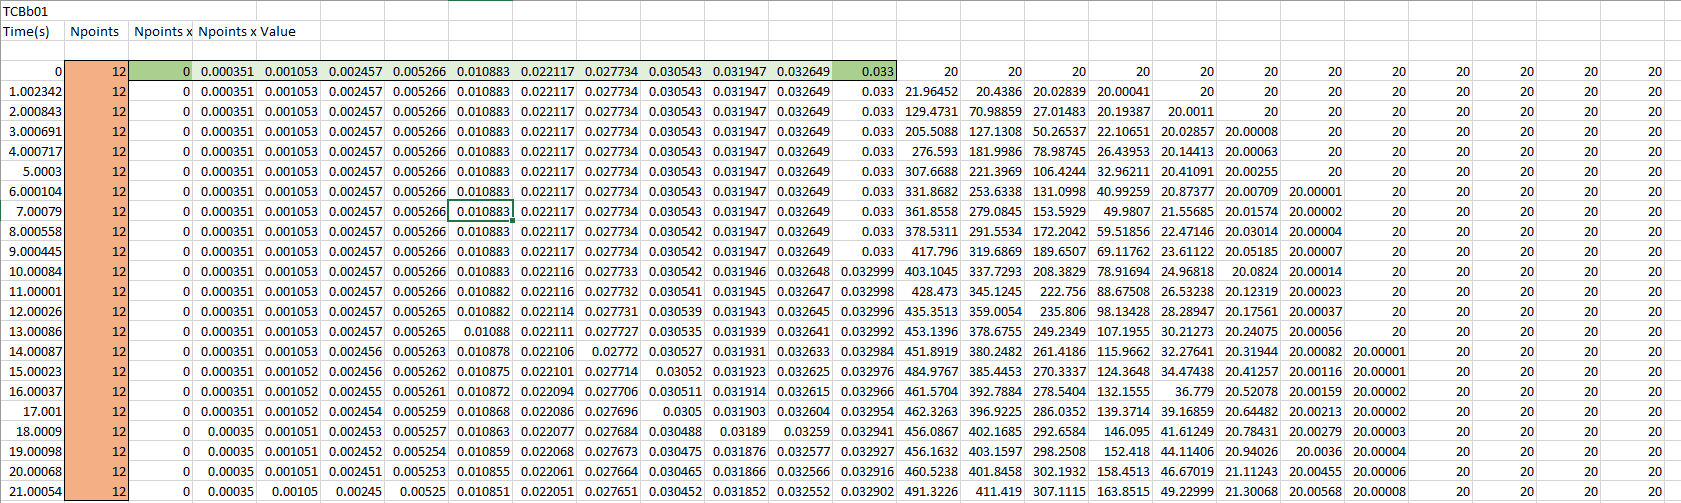
For the first type, I have placed a profile at each location, such as TCxa, TCxb, TCxc, TCxd, TCxf, TCxg, TCxi, and TCxl. But when I see the profile output results, each file has 12 node points along with their co-ordinates at every location, which essentially takes the thickness=33mm from the &SURF ID='CLT' as a reference, and the node co-ordinates start from 0mm to 33mm. Does it mean that the temperature columns of the 0 and 12th node points are 0 mm and 33 mm away from the point where I want to measure the temperature? If that is the case, the distance between each TC is less than 33mm, for example, 4mm between TCxa and TCxb. How do I understand these results?
For the second type, I decided to keep the profiles at the surface of every CLT, as the thickness of each CLT is 33mm. In this case, again, 12 node points with their co-ordinates and the node co-ordinates start from 0 mm to 33 mm. However, in this I won't be able to get the temperature at the exact locations of TCxa, TCxb, TCxc, TCxd, TCxf, TCxg, TCxi, and TCxl.
How do I understand these results? Which case is the right way to use to get the temperature at each location?
I have a fds case file and the results for reference.
I look forward to hearing from you. Any help is much appreciated.

dr_jfloyd
Oct 6, 2022, 2:58:13 PM10/6/22
to FDS and Smokeview Discussions
The grid size on the MESH is independent of the grid spacing used inside of a solid. If you want to see what the solid grid is, look at the .out file. How the solid grid spacing is determined and how to control the solid grid spacing is discussed in the User's Guide.
Unless you are using HT3D, there is no OBST to OBST heat transfer and there is no heat transfer through single OBST that are more than one grid cell thick. In these lines, the top OBST is not going to conduct heat into the second, and the second is not going to conduct into the third, and so on.
&OBST ID='CLT1', XB=1.5,2.0,1.0,2.0,1.335,1.368, BULK_DENSITY=450.0, SURF_ID='CLT'/
&OBST ID='CLT2', XB=1.5,2.0,1.0,2.0,1.368,1.401, BULK_DENSITY=450.0, SURF_ID='CLT'/
&OBST ID='CLT3', XB=1.5,2.0,1.0,2.0,1.401,1.434, BULK_DENSITY=450.0, SURF_ID='CLT'/
&OBST ID='CLT4', XB=1.5,2.0,1.0,2.0,1.434,1.467, BULK_DENSITY=450.0, SURF_ID='CLT'/
&OBST ID='CLT5', XB=1.5,2.0,1.0,2.0,1.467,1.5, BULK_DENSITY=450.0, SURF_ID='CLT'/
RNstu08
Oct 7, 2022, 6:36:32 AM10/7/22
to FDS and Smokeview Discussions
Thank you for the information about HT3D.
Also, I have attached my .out file. It shows the grid dimensions as I specified in the input file, and as far as the physical dimensions are concerned, it has made a round off for some dimensions.
I am more curious about the solid profiles. How do I understand the results?
For example, the thickness of each CLT is 33 mm, and for 5 layers it becomes 165 mm. If I place a solid profile at TCxa, which is the surface of the 1st CLT layer, i.e., 0 mm (as shown in CLT_layers.png), and the output of the solid profiles contains 12 node points with their node co-ordinates ranging from 0 mm to 33 mm (as shown in TCBa01.png). Here, 33 mm has been taken as a reference by fds which corresponds to CLT thickness. Does it mean the 1st nodepoint, which corresponds to a column of 0mm equivalent to the actual mentioned on the solid profile line (&PROF ID='TCBa01', XYZ=1.725, 1.525, 1.335, IOR=-3, QUANTITY='TEMPERATURE'/) for TCxa, and the 12th nodepoint corresponds to a column of 33mm equivalent to z=1.368m (i.e., 1.3355+0.033). Here, 1.335m is the z coordinate at which a solid profile was placed. Am I understanding it right?

Randy McDermott
Oct 7, 2022, 7:51:02 AM10/7/22
to fds...@googlegroups.com
The XYZ and IOR of a PROF are, like a DEVC, only used to find the WALL CELL for which the profile will be output. FDS starts at the XYZ and moves in the -IOR direction (in your case the IOR=-3, so FDS moves up (+3 direction) until it finds a WALL CELL [outer face of an OBST]). The center point of the WALL CELL is the first node of the 1D solver (may not be the XYZ of the PROF), with depth=0. The other node locations, relative to the 0, are listed in the .out file. These are independent of the physical locations in the gas phase domain.
If this is still confusing, I suggest studying the verification case here:
https://github.com/firemodels/fds/blob/master/Verification/Heat_Transfer/insulated_steel_column.fdswhich is written up in the FDS Verification Guide.
--
You received this message because you are subscribed to the Google Groups "FDS and Smokeview Discussions" group.
To unsubscribe from this group and stop receiving emails from it, send an email to fds-smv+u...@googlegroups.com.
To view this discussion on the web visit https://groups.google.com/d/msgid/fds-smv/c065a5da-688b-4296-8ad0-66e022a8338bn%40googlegroups.com.
RNstu08
Oct 7, 2022, 8:59:45 AM10/7/22
to FDS and Smokeview Discussions
It is bit clear now. However, how can we find the center point of the WALL CELL?
@dr_jfloyd I tried to use HT3D=T in the SURF line. But I got an error saying ERROR: DEVC 1 must be associated with a heat-conducting surface.
Randy McDermott
Oct 7, 2022, 9:16:52 AM10/7/22
to fds...@googlegroups.com
If you are interested in the surface on the bottom side of the OBST, then you use the XB(5) - epsilon as your "Z".
To view this discussion on the web visit https://groups.google.com/d/msgid/fds-smv/8e180412-5e35-4b31-85b8-c6f33cdbc59fn%40googlegroups.com.
RNstu08
Oct 7, 2022, 9:27:37 AM10/7/22
to FDS and Smokeview Discussions
What do you mean by XB(5) - epsilon?
"The center point of the WALL CELL is the first node of the 1D solver (may not be the XYZ of the PROF), with depth=0." How to find the center point of the WALL CELL?
"The center point of the WALL CELL is the first node of the 1D solver (may not be the XYZ of the PROF), with depth=0." How to find the center point of the WALL CELL?
Randy McDermott
Oct 7, 2022, 11:21:51 AM10/7/22
to fds...@googlegroups.com
epsilon is a small number. XB(5) is the fifth element of the OBST location.
To view this discussion on the web visit https://groups.google.com/d/msgid/fds-smv/f30163c4-1abb-4bc6-814b-b51632f68b32n%40googlegroups.com.
Example demo
Oct 7, 2022, 11:31:46 AM10/7/22
to fds...@googlegroups.com
Fifth element of the OBST. How do we get that?
Is it possible to give a small example, if you don't mind. It is bit confusing. You said center point of wall cell is the 1st node for 1D solver. But, where can I get the coordinates for this wall cell?
How about 3D solver? How does it work in 3D when I use HT3D =T?
If these things were already please help me look in that direction.
To view this discussion on the web visit https://groups.google.com/d/msgid/fds-smv/CAC6wax3tGNgHyvZxAjH8DJHpt-XWXwPUxPs3r63e5Ryou3nwCw%40mail.gmail.com.
Randy McDermott
Oct 7, 2022, 11:38:45 AM10/7/22
to fds...@googlegroups.com
You have entered the XB for an OBST in the input file. For example,
&OBST XB=0,1,0,1,10,11, SURF_ID='CLT'/
Then XB(5) = 10.
A PROF could be specified as
&PROF XYZ=0.5,0.5,9.99, IOR=-3, QUANTITY='TEMPERATURE'/
PROF does not work with the HT3D. There you have to use a DEVC, and in that case the position of the DEVC falls within a Cartesian cell. The DEVC records the value of temperature in that cell.
Please study the verification cases in fds/Verification/Heat_Transfer/*.fds
To view this discussion on the web visit https://groups.google.com/d/msgid/fds-smv/CAN%3Doa6ap9O3NGOcTuHfJoF6LnOO-X3-DBzrrBe4_p4ZbsmWV4g%40mail.gmail.com.
Example demo
Oct 7, 2022, 12:05:03 PM10/7/22
to fds...@googlegroups.com
That explained a lot. Thank you.
Even in this case, the PROF output file will have 'x' nodepoints and their node coordinates. So, how to find the values corresponding to the XYZ of the PROF.
To view this discussion on the web visit https://groups.google.com/d/msgid/fds-smv/CAC6wax08rZp8b3vFmO-Dr7wfT%2BktNLzi8QkA%3DjpkJW0j-b%2Bhtw%40mail.gmail.com.
Randy McDermott
Oct 7, 2022, 1:34:13 PM10/7/22
to fds...@googlegroups.com
The "depth" is in the direction opposite the IOR. In the example above, FDS will find an WALL CELL centered on (x,y,z) = (0.5,0.5,10.0). The node locations are at for i=1:n; (x_i,y_i,z_i) = (0.5,0.5,10+xnode_i).
To view this discussion on the web visit https://groups.google.com/d/msgid/fds-smv/CAN%3Doa6YB76hq_PoNNCM9ozs0gD7O6v9O_9aHWqSOR5LD4LDvQg%40mail.gmail.com.
RNstu08
Oct 27, 2022, 7:46:41 AM10/27/22
to FDS and Smokeview Discussions
In the above example given by you, is it possible to specify the PROF at three different locations or should it be possible only at (x, y) = 0.5, 0.5 (center point of the wall cell).
I have specified the PROF at three different locations as below. Will it be possible? If so, would I get different results at all these locations?
&MESH ID='Mesh01', IJK=20,20,220, XB=0.0,1.0,0.0,1.0,0.0,11.0/
&OBST ID='CLT', XB=0.0,1.0,0.0,1.0,10.0,11.0/
&PROF ID='left', XYZ=0.25,0.5,9.99, IOR=-3, QUANTITY='TEMPERATURE'/
&PROF ID='center', XYZ=0.5,0.5,9.99, IOR=-3, QUANTITY='TEMPERATURE'/
&PROF ID='right', XYZ=0.75,0.25,0.99, IOR=-3, QUANTITY='TEMPERATURE'/
&OBST ID='CLT', XB=0.0,1.0,0.0,1.0,10.0,11.0/
&PROF ID='left', XYZ=0.25,0.5,9.99, IOR=-3, QUANTITY='TEMPERATURE'/
&PROF ID='center', XYZ=0.5,0.5,9.99, IOR=-3, QUANTITY='TEMPERATURE'/
&PROF ID='right', XYZ=0.75,0.25,0.99, IOR=-3, QUANTITY='TEMPERATURE'/
Randy McDermott
Oct 27, 2022, 9:39:18 AM10/27/22
to fds...@googlegroups.com
Yes, it is possible, and you should get profiles dependent of the state of the 1D heat transfer solution for a given wall cell (yes, they can be different).
To view this discussion on the web visit https://groups.google.com/d/msgid/fds-smv/efcb6522-3261-46af-bf75-6ca644c0c3ccn%40googlegroups.com.
Reply all
Reply to author
Forward
0 new messages