how to show bar chat on distance
11 views
Skip to first unread message

Yudi Irawan
Jun 12, 2021, 7:02:23 AM6/12/21
to distance-sampling
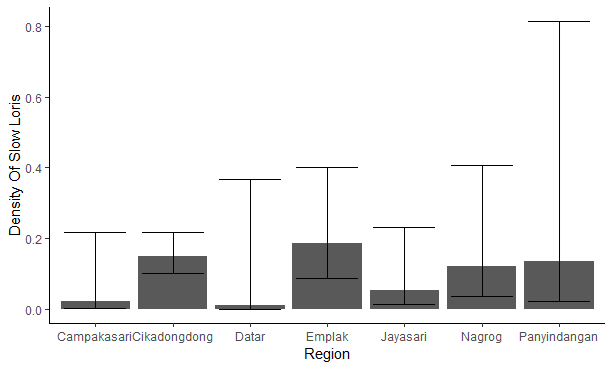
i used distance for a long time ago and i forget how to make and show this chart on distance
anyone can help me,?
thanks

Eric Rexstad
Jun 14, 2021, 2:00:08 AM6/14/21
to Yudi Irawan, distance-sampling
Yudi
Not sure whether you were using Distance for Windows or the R package Distance. Both sets of software produce point estimates of density along with upper and lower confidence interval bounds. You will want those three quantities to create each bar.
There are a host of ways to create bar plots with error bars in R. One web site describing how to create such plots can be found at
https://www.r-graph-gallery.com/4-barplot-with-error-bar.html
--
You received this message because you are subscribed to the Google Groups "distance-sampling" group.
To unsubscribe from this group and stop receiving emails from it, send an email to distance-sampl...@googlegroups.com.
To view this discussion on the web visit https://groups.google.com/d/msgid/distance-sampling/d1792391-d05e-485b-b6f7-dcbd3c355b8cn%40googlegroups.com.
--
Eric Rexstad
Centre for Ecological and Environmental Modelling
University of St Andrews
St Andrews is a charity registered in Scotland SC013532
Reply all
Reply to author
Forward
0 new messages