selecting a model with very different results

Jéssica Melo
Dear group,
I am analyzing data of humpback whale abundance during 2022 in a given area. We have standardize transects and we do replicates during whale season.
I have done many models with covariates that fit the data and they give me very different results regarding abundance (ranging from 600 to 2000 animals). The model with best AIC gives me a very low Pa (0.085) and high abundance. Another model including alpha transects in the analysis improved Pa (0.349) and reduced abundance, but it is not right to compare the AIC of models with different datasets, right?
I don’t feel comfortable choosing a model because here my decision is very important. The covariates can be explained (they are stratifications like region, survey and time – divided by time A and time B). When I put the survey as a covariate (survey is each completed fieldwork in the transects) is when I have better AIC and low Pa. It makes sense because there were surveys with very high numbers of whales and surveys with very low numbers, depending on whale migration. But I wonder if it is superestimating abundance here. What do you suggest to improve my model selection?
All the best,
Jéssica

Tiago Marques
--
You received this message because you are subscribed to the Google Groups "distance-sampling" group.
To unsubscribe from this group and stop receiving emails from it, send an email to distance-sampl...@googlegroups.com.
To view this discussion on the web visit https://groups.google.com/d/msgid/distance-sampling/82b7348f-120e-4c88-a620-a7ef395290d8n%40googlegroups.com.
Jéssica Melo


Eric Rexstad
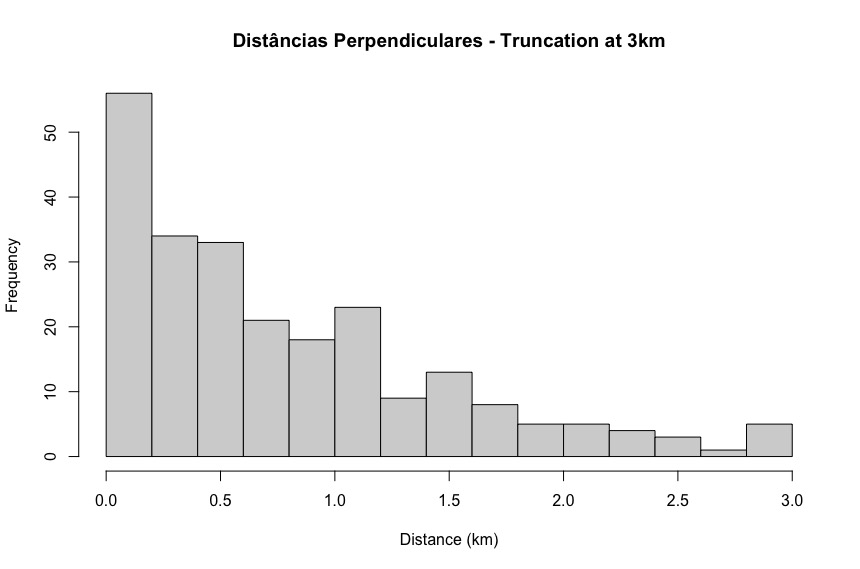
- Hazard rate model for your data: there appears a very steep drop in the number of detections between 0-200m and 200-400m. That seems unusual; you should try to understand whether this is plausible. The hazard rate model is trying to match that sharp drop off because the data is all it is provided. If it is more probable that detectability falls off more slowly than your data shows, then perhaps a half normal key function would be a more plausible model to use. (I would probably truncate a bit more strongly as well, that "bump" at 2.8-3.0km is likely the result of "noise" rather than "signal".
- Your alpha transects. Based on your explanation, seems these are not part of the actual survey (you are steaming to get to the start of a transect). It would be simplest to not include either the effort or detections made during the alpha transects. A more complicated thing to do would be to include the detections in modelling the detection function, but not in the effort calculation. If interested, we could discuss that separately.
- Finally replicate surveys, separated in time. How to cope with this depends upon what your surveys are trying to estimate. If you want to know the average number of whales in the study area over the time scale of the multiple surveys, then combining the
data across replicates would provide that estimate of average abundance. If you wish to have separate estimates for each survey, you might struggle with sufficient detections for each survey to estimate detectability separately. Then it might make sense to
use survey as a covariate to help model variation in detectability between replicates. If there are other complications (such as varying effort between replicates) then the average abundance ought to take varying effort into account; in that situation, you
would be doing a particular type of stratified survey in which stratification would be by "replicate". Check the documentation for the
dht2 function to learn about that.
Sent: 30 November 2022 11:34
To: Tiago Marques <tiagoand...@gmail.com>
Cc: distance-sampling <distance...@googlegroups.com>
Subject: Re: [distance-sampling] selecting a model with very different results

Stephen Buckland
Jéssica, a few comments.
- It is not an issue of something wrong with the hazard-rate model, but whether there is something wrong with the data. As Tiago noted, the hazard-rate may be fitting a spike in your data at zero. Your histogram shows that there is a spike. The hazard-rate model will tend to fit that spike whether it is real or reflects an issue with the data. The result will be high abundance estimates, low Pa, and poor precision. Usually with surveys of this type, if the data are spiked, it is because observers are often recording a zero sighting angle, which converts to zero distance from the line. You can easily check with your data whether that is the problem here. If it is, you may need improved observer training, and aids to estimating sighting angles, such as an angle ring on tripod-mounted binoculars, or an angle board. For existing data, you would want to avoid the hazard-rate model, and use models that do not fit this artificial spike, but some bias is likely to occur.
- The alpha transects are not part of the design, and there is no guarantee that they are through areas with typical densities, so you would want to exclude them from a standard analysis. You might want to try fitting a density surface model, and including those data in that model. With that approach, you do not have to assume that alpha transects pass through areas with average density.
- It sounds like you’re estimating a population within your survey region that varies appreciably in size. If that was not the case, you would just analyse the data as a single dataset, recording effort for a given line as its length multiplied by the number of times it was surveyed. Just seen that Eric has replied, and addresses this issue (and the others), so I’ll stop here!
Steve Buckland
From: distance...@googlegroups.com <distance...@googlegroups.com>
On Behalf Of Jéssica Melo
Sent: 30 November 2022 11:35
To: Tiago Marques <tiagoand...@gmail.com>
Cc: distance-sampling <distance...@googlegroups.com>
Subject: Re: [distance-sampling] selecting a model with very different results
Hi Tiago,
thank you for your help. I will try another model for the detection function to see if it's something wrong with the hazard rate. I attached the perpendicular distances frequency.
I'm sorry I didn't explain what an alpha transect is. We have "main" transects that we sample in each survey. But sometimes we make a visual effort to get to the starting point, this is what we call the alpha transect. These transects improved the Pa but reduced the total abundance, and I don't know which estimate would be the best.
I think my biggest question here is about replicates. Is there a different way to analyze replicates to get a total abundance of how many whales frequent the area? Because like I said, I put surveys as a covariate but maybe there's a better way to do this.
Jéssica
Em seg., 28 de nov. de 2022 às 18:03, Tiago Marques <tiagoand...@gmail.com> escreveu:
Dear Jéssica,
You should not compare AIC's when using different data. Those comparisons are meaningless.
You do not explain what is an alpha transect, and that seems key to understanding what is going on.
Using survey as a covariate can't be justified on the grounds that there are more or less whales due to migration, the covariates on the detection function impact the detection function, not the density. Therefore, survey would be a sensible covariate if e.g. different vessels or observers or sea state was observed in different surveys and you had not those survey level covariates recorded. Otherwise, using directly vessel, observer or sea state might be a better covariate, since survey would otherwise only represent proxies for the true factors impacting detectability. In a way, survey is a covariate that soaks any other survey level heterogeneity in the detection process that you have not recorded the relevant covariates to explain.
I suspect there is something rather strange going on with a spiked detection function leading to the P=0.085 (maybe a hazard rate detection function gone bad?), which then probably leads to the estimate of around 2000 animals. That might be a model that is not sensible for the sighting process - is it? - and might be the result of some rounding to 0 (common if you detect distances and angles, and many angles are small or rounded to 0). Of course I am only guessing since I have not seen your data, so this is only based on vague priors and no data (this is really a stats joke, bear with me).
Hope this helps, I must be honest this was the last thing I did before turning off the computer and it was a long day, so sorry if something does not add up here :)
Tiago
On Mon, 28 Nov 2022 at 20:15, Jéssica Melo <jessic...@pctsb.org> wrote:
Dear group,
I am analyzing data of humpback whale abundance during 2022 in a given area. We have standardize transects and we do replicates during whale season.
I have done many models with covariates that fit the data and they give me very different results regarding abundance (ranging from 600 to 2000 animals). The model with best AIC gives me a very low Pa (0.085) and high abundance. Another model including alpha transects in the analysis improved Pa (0.349) and reduced abundance, but it is not right to compare the AIC of models with different datasets, right?
I don’t feel comfortable choosing a model because here my decision is very important. The covariates can be explained (they are stratifications like region, survey and time – divided by time A and time B). When I put the survey as a covariate (survey is each completed fieldwork in the transects) is when I have better AIC and low Pa. It makes sense because there were surveys with very high numbers of whales and surveys with very low numbers, depending on whale migration. But I wonder if it is superestimating abundance here. What do you suggest to improve my model selection?
All the best,
Jéssica
--
You received this message because you are subscribed to the Google Groups "distance-sampling" group.
To unsubscribe from this group and stop receiving emails from it, send an email to distance-sampl...@googlegroups.com.
To view this discussion on the web visit https://groups.google.com/d/msgid/distance-sampling/82b7348f-120e-4c88-a620-a7ef395290d8n%40googlegroups.com.
--
You received this message because you are subscribed to the Google Groups "distance-sampling" group.
To unsubscribe from this group and stop receiving emails from it, send an email to
distance-sampl...@googlegroups.com.
To view this discussion on the web visit https://groups.google.com/d/msgid/distance-sampling/CAN4VzkGKc6Kxq%3DTbtX6qEQ1Mn%3DU68JQ5xh%2BVJnQyAmLJ0CobTw%40mail.gmail.com.
Jéssica Melo
Eric Rexstad
To: Stephen Buckland <st...@st-andrews.ac.uk>
Cc: Tiago Marques <tiagoand...@gmail.com>; distance-sampling <distance...@googlegroups.com>
Stephen Buckland
Jéssica, adding to Eric’s comments, if model fit is poor, that can be because the model is a poor choice, or it can mean that there is a problem with the data. If your distances are subject to a lot of rounding, then the hazard-rate model may appear to provide a better fit than the half-normal, but the half-normal may give lower bias. Have you investigated your data? Are there a number of zeros in the perpendicular distances? If so, you may want to increase the width of your first interval when assessing goodness-of-fit, so that the first interval extends out beyond the distances that might plausibly get rounded to zero. If you only have very few zeros in the data, then you might want to try truncating more. But spend some time exploring the data and understanding them – that will then inform your decisions on how best to model them.
Steve Buckland
Jéssica Melo
Stephen Buckland
Sent: Wednesday, November 30, 2022 7:55:02 PM
To: Stephen Buckland <st...@st-andrews.ac.uk>
Cc: Eric Rexstad <Eric.R...@st-andrews.ac.uk>; Tiago Marques <tiagoand...@gmail.com>; distance-sampling <distance...@googlegroups.com>