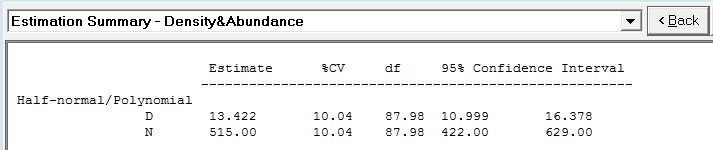
Is estimated "D=13.422" in this picture the last population density?

xiangjun zhou
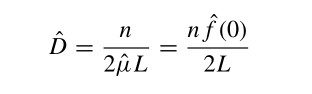
but I also saw another calculation method of populaition density, which is
xiangjun zhou

Stephen Buckland
Impossible to tell, from the information you provide, but you indicated your animals can be in groups. Then, n is not the number of animals detected, but the number of groups. You also need to multiply by estimated mean group size in the population. (Using the default methods in the software, this isn’t simply the mean size of groups detected, because there is usually bias with larger groups being more detectable.) You also have to take care that you’re working with the same units as the software, e.g. with area as hectares.
Steve
From: distance...@googlegroups.com <distance...@googlegroups.com>
On Behalf Of xiangjun zhou
Sent: 03 May 2022 07:57
To: distance-sampling <distance...@googlegroups.com>
Subject: {Suspected Spam} [distance-sampling] Re: Is estimated "D=13.422" in this picture the last population density?
animal population density was 13.422 or 0.02524,I want to why these results are quite different? thanks
在2022年5月3日星期二 UTC+8 11:51:23<xiangjun zhou> 写道:
but I also saw another calculation method of populaition density, which is
when I calculated density using above method, I found the results were total different. the detail was as follows:
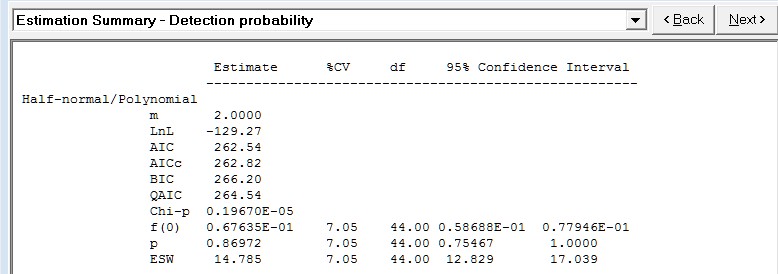
form this picture,we can acquired “f(0)= 0.67635E-01 ” ,so D=93*0.67635E-01/(2*124.602)=0.02524, 93 is animal quantity, 124.602 is total L, I want to know why and its reaon?thank a lot
--
You received this message because you are subscribed to the Google Groups "distance-sampling" group.
To unsubscribe from this group and stop receiving emails from it, send an email to
distance-sampl...@googlegroups.com.
To view this discussion on the web visit
https://groups.google.com/d/msgid/distance-sampling/a673d653-d400-4336-9046-6c38fd4e01f5n%40googlegroups.com.

Eric Rexstad
- Using the values you provide for number of detections (93) and line length (124.602), the same value of D-hat is produced from both of the formulas.
Sent: 03 May 2022 04:51
To: distance-sampling <distance...@googlegroups.com>
Subject: {Suspected Spam} [distance-sampling] Is estimated "D=13.422" in this picture the last population density?
To unsubscribe from this group and stop receiving emails from it, send an email to distance-sampl...@googlegroups.com.
xiangjun zhou
Eric Rexstad
To: distance-sampling <distance...@googlegroups.com>
Subject: {Suspected Spam} Re: {Suspected Spam} [distance-sampling] Re: Is estimated "D=13.422" in this picture the last population density?
xiangjun zhou
Eric Rexstad
To: distance-sampling <distance...@googlegroups.com>
Subject: {Suspected Spam} Re: {Suspected Spam} Re: {Suspected Spam} [distance-sampling] Re: Is estimated "D=13.422" in this picture the last population density?