point transect and left truncation

Marjorie Bison
I come back to you for a new concern about point transect and left truncation.
5 point-transects have been performed to study ibex population (sampled since 2000, 2 or 3 times a year). Observers are not located physically within the observed population but at distances that vary according to the point-transect. For example, for the observation point n°1, observer is located on the other side of the valley, which allows the observer to see all the other side of the mountain where the population is (the observation points are easily accessible, that's why we chose this design. Going into the population to count them would require a lot of time, people and energy). Distances are calculated on a map from the observer to the clusters of individuals. This observer n°1 is located at 680 m from the first cluster of individuals. The distances between the observers and the closest cluster varies between point transect (e.g. observer n°2 is located at 370m from the closest cluster) and distances are never small or equal to 0.
An important point is that observers are generally separated from the other side of the mountain by the valley and a river where no individuals can be observed (because they never go there, low altitude).
This implies that we have to take into account a left-truncation in our data analysis. Right ?
1- Left-truncation distances varie between point transect, how do we deal with this in the "ds" function with R (as the left-truncation only requires a single number) ?
2- Should we analyse each point transect individually even if it decreases the power of the analysis ?
3- Should we use left-truncation (assuming g(x) is different to 1 at the truncation point) or substract the truncation distances (different according to point transect) from all the data (assuming that g(x)=1 at the truncation distance) ? The latter case would imply that the location of the observer is not important in the observation, which is not true.
It is not very easy to explain, I hope you will understand my problem !
Thanks a lot for your help
Cheers
Marjorie

Mark Wilson

Eric Rexstad
Marjorie
I concur with Mark's points 1-3.
I'm trying to think of ways this survey design might work, but
I'm afraid I identify more challenges this design possesses.
Recognise that even if the design was perfect, drawing inference
from 5 transects will limit you ability to accurately estimate
encounter rate variability. The fewer transects, the more suspect
is the inference extended from those 5 transects to a broader
study area. You also note "observation points are easily
accessible" hence they are not representative of the study area.
Along with the non-representativeness Mark's issue 3 about
distribution of animals with respect to distance from the point
also arises in your design.
Now to the matter that the observers are not situated at the centre of the point transect, rather are located at "distance that are never small." I wonder how much ibex detectability would actually vary as a function of distance from the transect centre under your design. Central tenet of distance sampling is the existence of information in detection distance to help estimate detection probability through fitting a detection function. I am sceptical that information content of detection distance in this situation would be of much use in producing a defensible estimate of detection probability.
Independent of the mechanics of performing left-truncation upon
the data, I would be reluctant to perform a distance sampling
analysis upon these data as I would be dubious of the result.
--
You received this message because you are subscribed to the Google Groups "distance-sampling" group.
To unsubscribe from this group and stop receiving emails from it, send an email to distance-sampl...@googlegroups.com.
To post to this group, send email to distance...@googlegroups.com.
To view this discussion on the web visit https://groups.google.com/d/msgid/distance-sampling/302f9afc-6539-4163-9467-5f06325b9c70%40googlegroups.com.
For more options, visit https://groups.google.com/d/optout.
--
Eric Rexstad
Research Unit for Wildlife Population Assessment
Centre for Research into Ecological and Environmental Modelling
University of St. Andrews
St. Andrews Scotland KY16 9LZ
+44 (0)1334 461833
The University of St Andrews is a charity registered in Scotland : No SC013532
Marjorie Bison

PABLO PALENCIA MAYORDOMO
Hi folks!
I’m coming with similar questions that the one initially posted by Marjorie three years ago (probably because my target species is the same: ibex, haha). Marjorie, do you finally analysed your data?
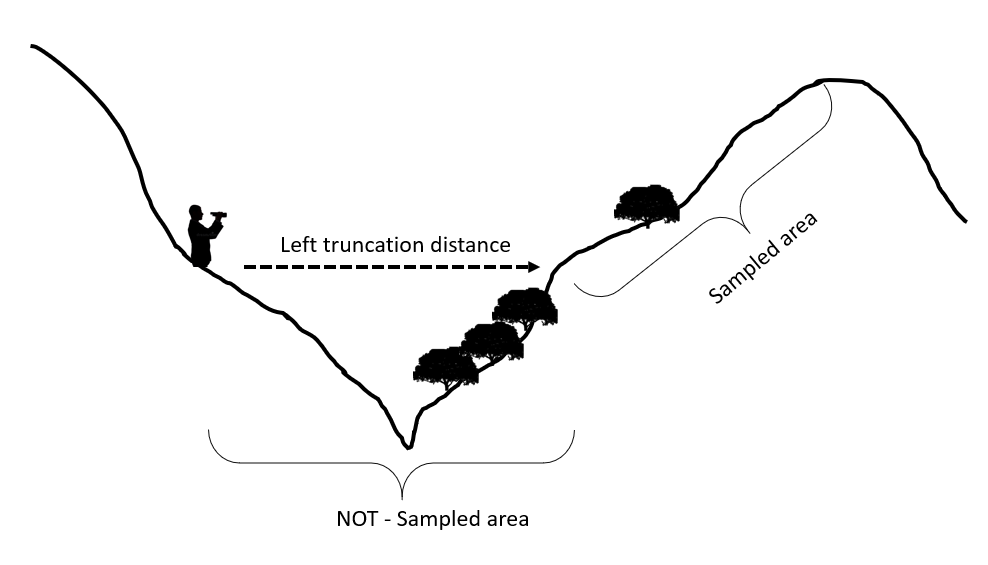
Briefly, I surveyed a high mountain population of ibex by point-transect distance sampling. Because of the practical limitations of these habitats, our sampling points were usually located on one side of the valley, and we surveyed “the other side” of the mountain (see my fancy figure "DesignSM.png", please). Additionally, I would like to note that we sampled around 50 points distributed all over the study area (so some of the limitations highlighted in the previous comments are solved here, I think..).
This design implies that left-truncation should be considered, essentially because the closer distances to the observers locations are blinded. The issue is that this blind area is point-specific, and a specific left truncation distance should be considered for each point location. As it is not possible on the analyses (a general left (and right) truncation distance should be considered during analysis), how can we include this variability?
Here my thoughts:
- One option could be to apply stratified analyses, and considered in each strata sampling points with similar left truncation distances.
- Second option, is to subtract the distance between the observer and the closest point of the surveyed zone. Doing that, we assumed perfect detection at the beginning of the surveyed area, and I think that it could be assumed in most of the points because we used binoculars and a telescope on all the points, and left truncation distances are around 200m in most of them. However, I’m wondering about points with longer blind distances (around 500-600m) in which should be necessary to assume perfect detection at 500-600m, that could be contradictory according to the previous lines.
- Third option is don’t consider left truncation, and then estimate a “correction factor” based on the ratio between surveyed area divided by the theoretical surveyed area.
(See "AnalSM.png")
- Fourth option?
PD: I would like to note that I didn't found any protocol about that on the bibliography. I just found a brief comment about that on Buckland et al 2001 (section 6.7, pag 215), but I think that these issues should be addressed by someone before... (as this group evidence haha), so please, let me know any paper focused on that.
Thank you very much for your time
Looking forward to your response
All the best
Pablo
Eric Rexstad
Pablo
Thanks for the handsome artwork, it makes it easier to understand your field situation. I understand the difficulty of the mountainous terrain.
When employing point transect distance sampling the quantity that is most critical to the estimation is the slope of the probability density function at distance 0 (h(0)).
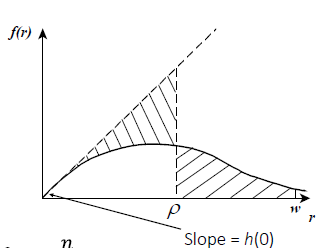
Left truncation removes data in the vicinity of the point, making estimation of that fundamental quantity difficult, so recognise your challenges.
Of the options you propose, I would suggest the use of #2 for treating the point-specific left truncation distance. I don't know what implications this might have for study-wide right truncation you might wish to apply.
Are your figures drawn roughly to scale? Specifically, is the left-truncation distance approximately equal to at least one-half the total detectability distance? If so, I wonder if distance sampling is appropriate. Remember, we measure distances because we assume detectability changes as a function of distance. In the situation you depict, the range of distances where you can detect animals is small (<1/2) relative to the total distance from the observer to the top of the adjacent mountain. My fear is that detectability of ibex varies only a small amount within your "real area surveyed" distances. Fitting a detection function to such data would likely result in a very flat detection function; implying detectability really is not a function of distance in your situation. You can assess this quite easily by simply plotting a histogram of your detection distances.
One other issue that occurs to me as a
non-ibex biologist. Are ibex equally likely to be at all
elevations depicted in your figure? If they have elevational
preferences (either likely to be on the tops or avoid the tops)
then that will cause difficulties in your analysis as it assumes
animals are equally likely to be at all distances from the
points.
To view this discussion on the web visit https://groups.google.com/d/msgid/distance-sampling/97053efd-aa3a-4938-9356-fd47ed85c8b2n%40googlegroups.com.
--
Eric Rexstad
Centre for Ecological and Environmental Modelling
University of St Andrews
St Andrews is a charity registered in Scotland SC013532
PABLO PALENCIA MAYORDOMO
Eric Rexstad
Pablo
Your Q1: if each point has a different angle of view, you can make station-specific adjustments to your data by altering the Effort field. Rather than setting this field to "1", you can set it to the proportion of the circle you sampled for that point.
Your Q2: You provided this figure in your
earlier email. I can't work out how you would apply your
point-specific correction factor to the overall density
estimate. You won't be producing point-specific density
estimates from your survey, but rather a single density estimate
for the entire survey.
To view this discussion on the web visit https://groups.google.com/d/msgid/distance-sampling/2a4f28a8-17c8-415f-9606-26fe2caaba70n%40googlegroups.com.
PABLO PALENCIA MAYORDOMO
Eric Rexstad
Pablo
I understand the analogy with animal activity camera trap distance sampling. If you pursue that course, you will need to propagate the variability in your correction factor by not only including the correction factor as a multiplier, but also the standard error of that mean correction factor.
The propagation of uncertainty is described in the lecture material
https://workshops.distancesampling.org/online-course/lecturepdfs/Ch6/L6-2%20Multipliers.pdf
To view this discussion on the web visit https://groups.google.com/d/msgid/distance-sampling/ce36ffd5-9c39-48bd-8bd9-5a3624dbce6cn%40googlegroups.com.