Heatmap for differential regions identified by DiffBind - Interpret
407 views
Skip to first unread message

jingyu...@brown.edu
Oct 15, 2019, 3:08:09 PM10/15/19
to deepTools
Hello,
I need some help of interpreting the heatmap and average-plot of differential binding (DB) peaks from my 2 samples. I would like to visualize the DB results after the differential analysis and see what make the difference. Here is my plot:
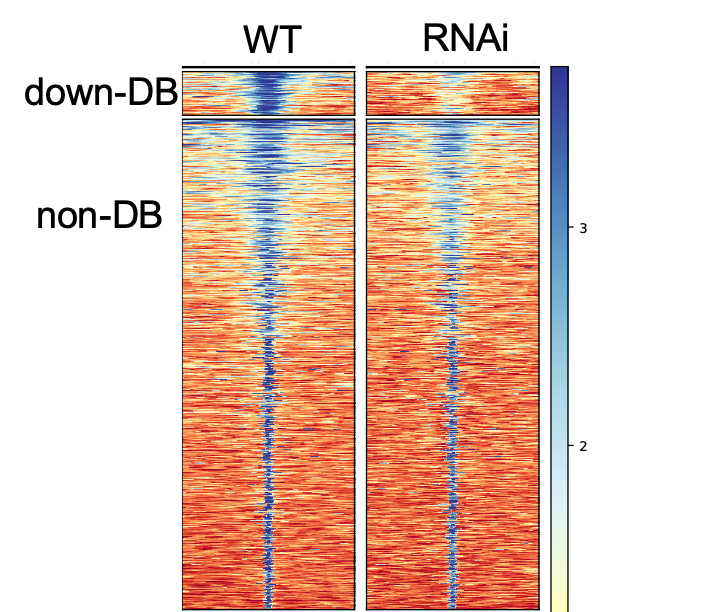
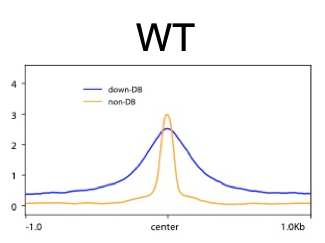
It seems like the DB and non-DB has very different peak-size distribution. Does this mean the DB regions have more IP-protein occupancy with a broad binding? and non-DB has narrow binding?
Maybe DB regions has IP-protein multimer? Can I interpret it this way?
Thank you very much for your help!
Best,
Ellie

Devon Ryan
Oct 16, 2019, 2:19:20 AM10/16/19
to jingyu...@brown.edu, deepTools
Hi Ellie,
The DB peaks certainly seem to be those with the highest initial binding amount. I think this is also the primary cause of the increased peak breadth. While you can't conclude from this that you have multimers, it's certainly compatible with what you're seeing. You should be able to check that suspicion on the wet-lab side of things with a Western.
Best,
Devon
--
Devon Ryan, Ph.D.
Email: dpr...@dpryan.com
Data Manager/Bioinformatician
Max Planck Institute of Immunobiology and Epigenetics
Stübeweg 51
Devon Ryan, Ph.D.
Email: dpr...@dpryan.com
Data Manager/Bioinformatician
Max Planck Institute of Immunobiology and Epigenetics
Stübeweg 51
79108 Freiburg
--
You received this message because you are subscribed to the Google Groups "deepTools" group.
To unsubscribe from this group and stop receiving emails from it, send an email to deeptools+...@googlegroups.com.
To view this discussion on the web visit https://groups.google.com/d/msgid/deeptools/b4b64b3e-151c-47ac-a374-7e4c2f29b61a%40googlegroups.com.
jingyu...@brown.edu
Oct 16, 2019, 7:33:47 AM10/16/19
to deepTools
Hi, Devon,
Thank you so much for the reply! It is very helpful for me to understand the heatmap.
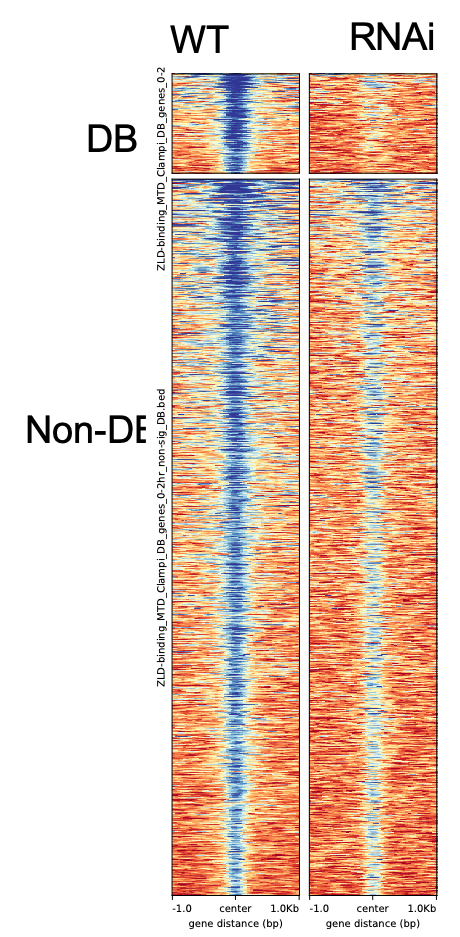
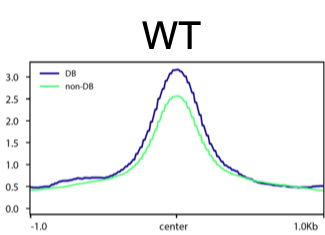
One more thing to check with you. If I run the same heatmap/average-plot to the DB non-DB result from Csaw package, it has very different distribution. The previous plot I used DiffBind results. I'm not sure which result to use for the downstream, the DB are also not very overlapped from 2 packages. Any suggestions? Thank you very much!
Best,
Ellie
On Wednesday, October 16, 2019 at 2:19:20 AM UTC-4, Devon Ryan wrote:
Hi Ellie,The DB peaks certainly seem to be those with the highest initial binding amount. I think this is also the primary cause of the increased peak breadth. While you can't conclude from this that you have multimers, it's certainly compatible with what you're seeing. You should be able to check that suspicion on the wet-lab side of things with a Western.Best,Devon--
Devon Ryan, Ph.D.
Email: dpr...@dpryan.com
Data Manager/Bioinformatician
Max Planck Institute of Immunobiology and Epigenetics
Stübeweg 5179108 Freiburg
On Tue, Oct 15, 2019 at 9:08 PM <jingyu...@brown.edu> wrote:
Hello,--I need some help of interpreting the heatmap and average-plot of differential binding (DB) peaks from my 2 samples. I would like to visualize the DB results after the differential analysis and see what make the difference. Here is my plot:
It seems like the DB and non-DB has very different peak-size distribution. Does this mean the DB regions have more IP-protein occupancy with a broad binding? and non-DB has narrow binding?
Maybe DB regions has IP-protein multimer? Can I interpret it this way?
Thank you very much for your help!
Best,
Ellie
You received this message because you are subscribed to the Google Groups "deepTools" group.


To unsubscribe from this group and stop receiving emails from it, send an email to deep...@googlegroups.com.

Thomas Manke
Oct 16, 2019, 7:51:00 AM10/16/19
to jingyu...@brown.edu, deepTools
Hi Ellie,
Before reverse-engineering different callers for differential peaks, I would suggest that you collect the union of regions and let deepTools do the clustering with various k.
This may give you a more robust classification. In your last plot it is not particularly clear why cSAW calls those regions as non-DB.
Best wishes,
Thomas
To unsubscribe from this group and stop receiving emails from it, send an email to deeptools+...@googlegroups.com.
To view this discussion on the web visit https://groups.google.com/d/msgid/deeptools/03643966-ff87-49a2-9c8d-6614e2d3524a%40googlegroups.com.
--
Dr. Thomas Manke
Head of Bioinformatics
Max Planck Institute of Immunobiology and Epigenetics
Stübeweg 51, 79108 Freiburg, Germany
Tel. +49-761-5108 738
Fax  +49-761-5108 80738
jingyu...@brown.edu
Oct 16, 2019, 8:00:02 AM10/16/19
to deepTools
Hi, Thomas,
Thank you very much for the suggestion! I will try K-clustering in deeptools! Do you suggest that regions that in different clusters could be a better representation and more robust than DB? Can I use them the same as DB in downstream to search for their motif and GO terms?
Thank you!
Best,
Ellie
To view this discussion on the web visit https://groups.google.com/d/msgid/deeptools/03643966-ff87-49a2-9c8d-6614e2d3524a%40googlegroups.com.
Reply all
Reply to author
Forward
0 new messages