india building footprints
1,339 views
Skip to first unread message

Justin
May 17, 2022, 6:21:31 PM5/17/22
to datameet


Nikhil VJ
May 18, 2022, 4:58:19 AM5/18/22
to datameet, talk-in
Thanks Justin for sharing!
I've downloaded and extracted the India.geojsonl on a webserver.
ref about .geojsonl : https://www.interline.io/blog/geojsonl-extracts/
-> pretty useful! One can loop through a huge file without having to load it all into RAM.
top lines look like:
{"type": "Feature", "properties": {},"geometry": {"type": "Polygon","coordinates": [[[83.06380515611697, 25.34167404697847], [83.06380909901775, 25.341635591519122], [83.06386494585949, 25.341640268589657], [83.06386100295869, 25.341678724047526], [83.06380515611697, 25.34167404697847]]]}}
{"type": "Feature", "properties": {},"geometry": {"type": "Polygon","coordinates": [[[87.87555977691633, 22.397660095199], [87.8754256865811, 22.397658576750985], [87.87542690191553, 22.397566835386712], [87.87556099225075, 22.39756835383578], [87.87555977691633, 22.397660095199]]]}}
{"type": "Feature", "properties": {},"geometry": {"type": "Polygon","coordinates": [[[87.87555977691633, 22.397660095199], [87.8754256865811, 22.397658576750985], [87.87542690191553, 22.397566835386712], [87.87556099225075, 22.39756835383578], [87.87555977691633, 22.397660095199]]]}}
...
So we have just basic polygons, one for each building, no properties or categorization.
Here are some ideas on what to do with this:
1. Postgresql DB:
- Load all of these into a PostGreSQL DB
- Setup an api that will take a lat/lon and give all shapes within 1km radius
- Next possible api: send a bounding polygon and get all buildings in that
2. Split up by district or lower level admin boundaries:
- Load the admin boundaries into a Postgresql DB
- Loop through each line (ie each building)
- Find out which place it's in by ST_Within query
- Dump it into a separate .geojsonl for that place
- We've now split it into multiple smaller files that are more usable, can be loaded up by OSM mappers etc.
On Wed, May 18, 2022 at 3:51 AM Justin <justinell...@gmail.com> wrote:
--
Datameet is a community of Data Science enthusiasts in India. Know more about us by visiting http://datameet.org
---
You received this message because you are subscribed to the Google Groups "datameet" group.
To unsubscribe from this group and stop receiving emails from it, send an email to datameet+u...@googlegroups.com.
To view this discussion on the web visit https://groups.google.com/d/msgid/datameet/68c0ecc4-5b07-4eb9-a69d-ae6e5ad6832bn%40googlegroups.com.

Bibhash Nath
May 24, 2022, 12:44:02 AM5/24/22
to data...@googlegroups.com, talk-in
Thanks for sharing.
Do we have state-wise datasets? It seems quite large to process on my computer.
Best,
Bibhash
To view this discussion on the web visit https://groups.google.com/d/msgid/datameet/CAH7jeuM_yRYLDRir7vYjT7JVoP-J%2BkWAEkbp_U84QSb82AX3aA%40mail.gmail.com.
Nikhil VJ
May 24, 2022, 3:33:41 AM5/24/22
to datameet, talk-in
Hi Bhibhash,
Short answer: No.
There is no metadata. I took the top 1000 lines and visualized it : the shapes were spread all over the country and there wasn't any order in them.
With an intern's help I've started import of them into a portable postgresql DB (dockerized with a persistent volume) on my webserver. Started yesterday and it's 10 million shapes in; from size comparisons it'll probably be around 79 million shapes, so should be imported in a week's time.
I've set an auto-increment primary key column in the DB table, so once imported at least the data can be pulled out in batches.
There are 2 paths ahead once I've imported it:
-------
1. Serving vector tiles
I want to serve MVT vector tiles from this DB - and then have a map display the same. That way one can directly have this stuff render on a map as they browse it - fetching only one small region at a time and hopefully not being too slow.
Finding some references here:
I'm new to this MVT business, so if anybody wants to collaborate pls feel free to jump in.
------
2. Tag with region ids
Add columns to the DB table and tag each shape by state, district ids etc using Within operations either in the DB or in python-geopandas.
To view this discussion on the web visit https://groups.google.com/d/msgid/datameet/CAHRkDO5qPr_E68nzFiTh%3DxSPd1myz0_WMbJi83mdQMDZ53pEkQ%40mail.gmail.com.

Deepak Sharda
May 24, 2022, 4:18:57 AM5/24/22
to data...@googlegroups.com
Hello Nikhil,
I would definitely love to collobrate. The best i would suggest is to make Mbtiles and host them as data is not going to change a lot so most of the time static.
Rendering from hosted Mbtiles will not only fast but easy to handle on small web server.
How to proceed.
First creation of Mbtiles
second Hosting of Mbtiles
Third Styling at client side.
Thanks
To view this discussion on the web visit https://groups.google.com/d/msgid/datameet/CAH7jeuOo0vfbxnsv%2B-V7%2Bt7zgkNGruyaT0xzULECGc-e8h3Qcw%40mail.gmail.com.
Nikhil VJ
May 26, 2022, 9:10:01 AM5/26/22
to datameet, talk-in
Hi Deepak,
Thanks for the suggestion.
I came across tippecanoe again : https://github.com/mapbox/tippecanoe
and finally seeing a use case for it. So, while the DB is still being loaded, started off tippecanoe program on the original .geojsonl.
The program was quite fast - in about 6 hrs it had generated a 1.4GB .mbtiles file and it didn't even take too much RAM.
Then, with the help of https://github.com/maptiler/tileserver-php:
This vector tiles URL is working at my end in QGIS:
I was looking for options to generate raster .png etc tiles, but haven't found one yet.
I also saw an option in tippecanoe to output .pbf tiles to a folder instead of a single .mbtiles file. Did a couple of runs, but that hasn't worked out.
Meanwhile, Sreeram-K posted in OSM-India telegram group: folks at mapwith.ai have incorporated the data and are now showing it in their rapID editor alongwith the AI roads data, as suggestions for openstreetmap editing. One link:
To view this discussion on the web visit https://groups.google.com/d/msgid/datameet/CA%2B4SsQCfA5dxiWne%3Dsghbn8OH_FoBgKUDtVeF9hMs%2BxU6he_JQ%40mail.gmail.com.
Deepak Sharda
May 26, 2022, 9:37:40 AM5/26/22
to data...@googlegroups.com
To make folder structure mbtile you might need to add ''-e'' in the recipe.
or tile is made you can use Mbutil to create folder structure from single file.
To your second query to create building footprints with rater tiles there are two ways two approach it.
You can create raster tiles from geotiff by using tiles2py in folder structure.
But in your case you can use Tileserver-gl what it does is it can host vector tiles but serve them as raster.
You can check config file and change as per your requirements such as 256x256 or 512x512.
let me know if you still face issue.
Note - Go by vector tiles its fast and you can give 3D effect as you have seen in our app.
Thanks and Regards
To view this discussion on the web visit https://groups.google.com/d/msgid/datameet/CAH7jeuMh1dDpd%2BH8RNDGUPbitt5hr3ZEZMSf6w7qehjQyB9Gyg%40mail.gmail.com.
Nikhil VJ
May 30, 2022, 4:03:58 AM5/30/22
to datameet, talk-in
Hi All,
India data from Microsoft's ML Buildings Footprints data release is deployed on both vector and raster tile layers:
This is a TileServer GL instance.
Recipe for how this was done and the configs etc reqd is shared here:
This process may be useful for working with other large datasets also.
To overlay on JOSM, pls use this PNG layer:
For raster overlay in browser, pls use webp format which is smaller and faster:
For vector tiles (will work in QGIS also), pls use this:
There was a lot of troubleshooting needed for getting the raster output working - big thanks to Deepak Sharda for help in that.
Meanwhile, I've also completed importing the data to a postgis DB. If anyone wants data for a limited region, pls reach me on nikhil.js [at] gmail.com
To view this discussion on the web visit https://groups.google.com/d/msgid/datameet/CA%2B4SsQDbj2pQ8Ehk8JTHCMmoTAqMCBTEBevunpgYCMkon8oC6Q%40mail.gmail.com.
Bibhash Nath
May 30, 2022, 8:16:00 AM5/30/22
to data...@googlegroups.com, talk-in
Thanks Nikhil for sharing this.
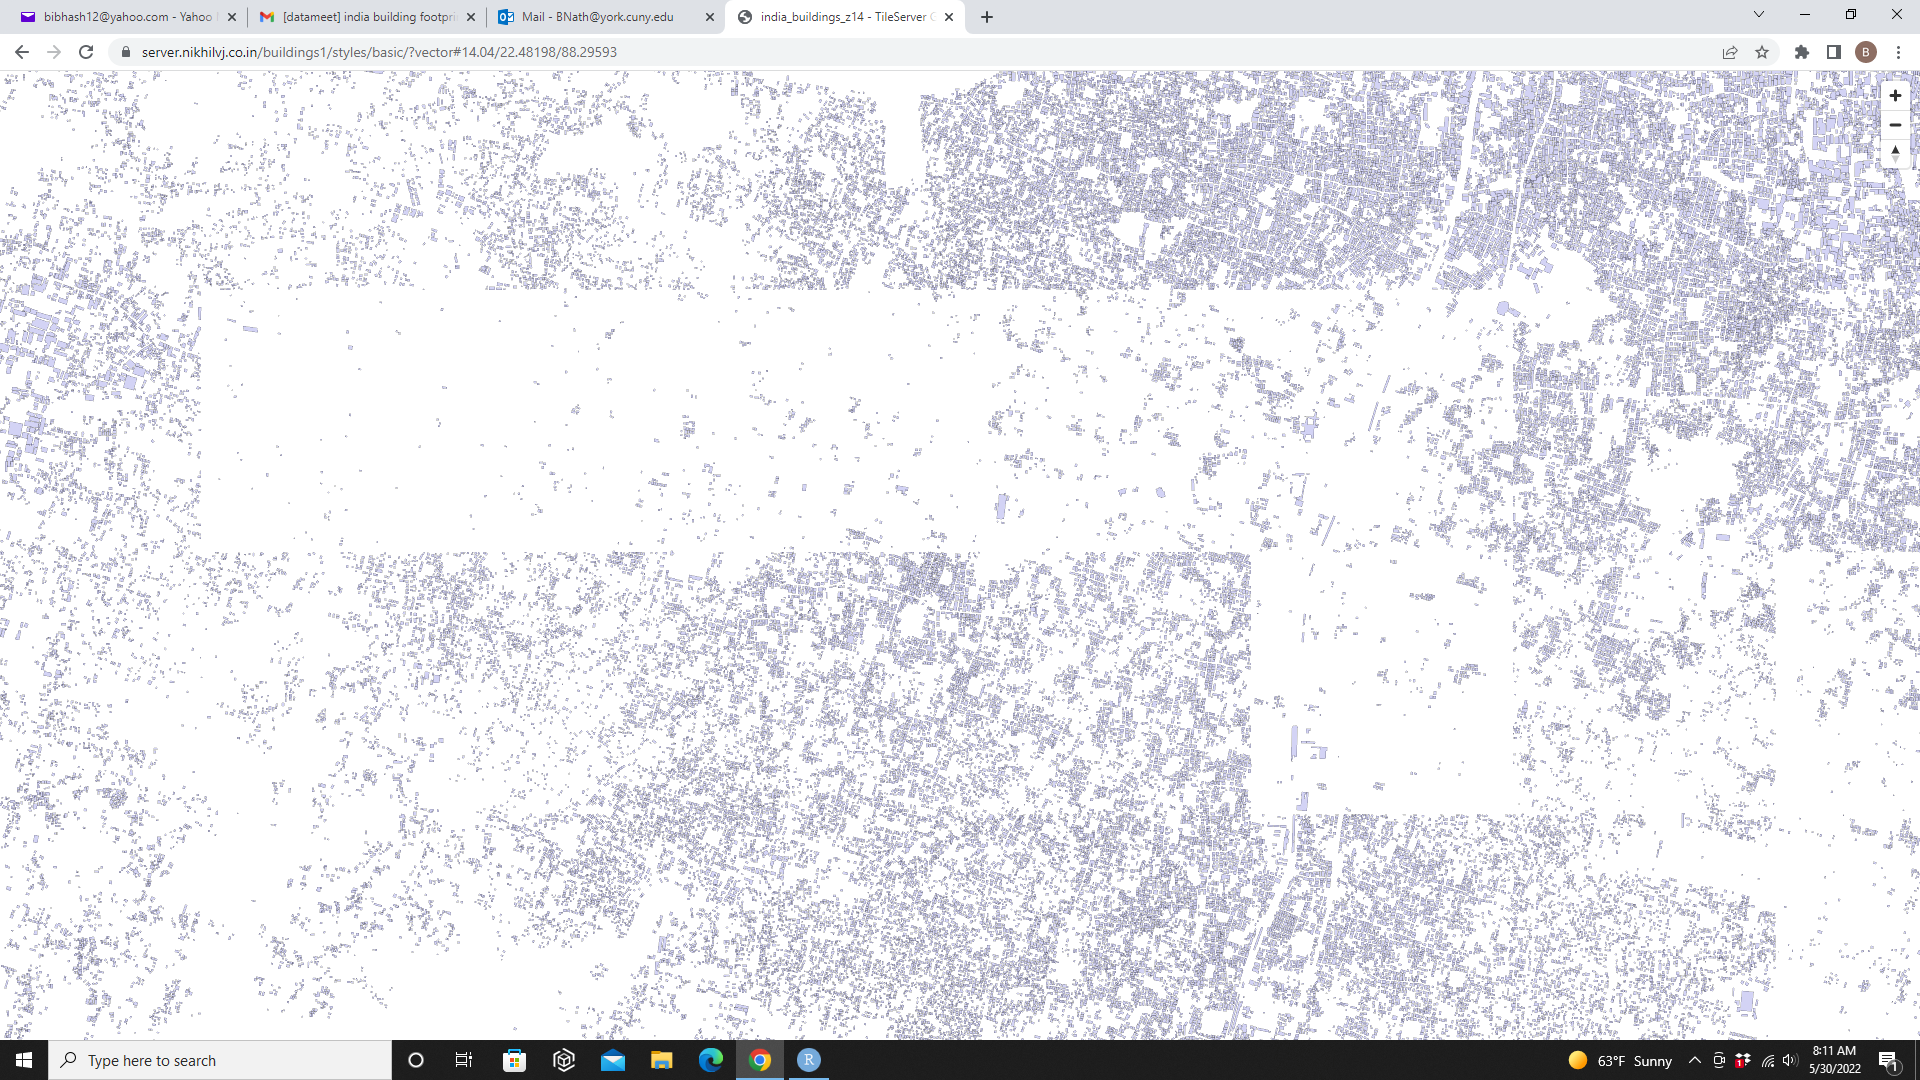
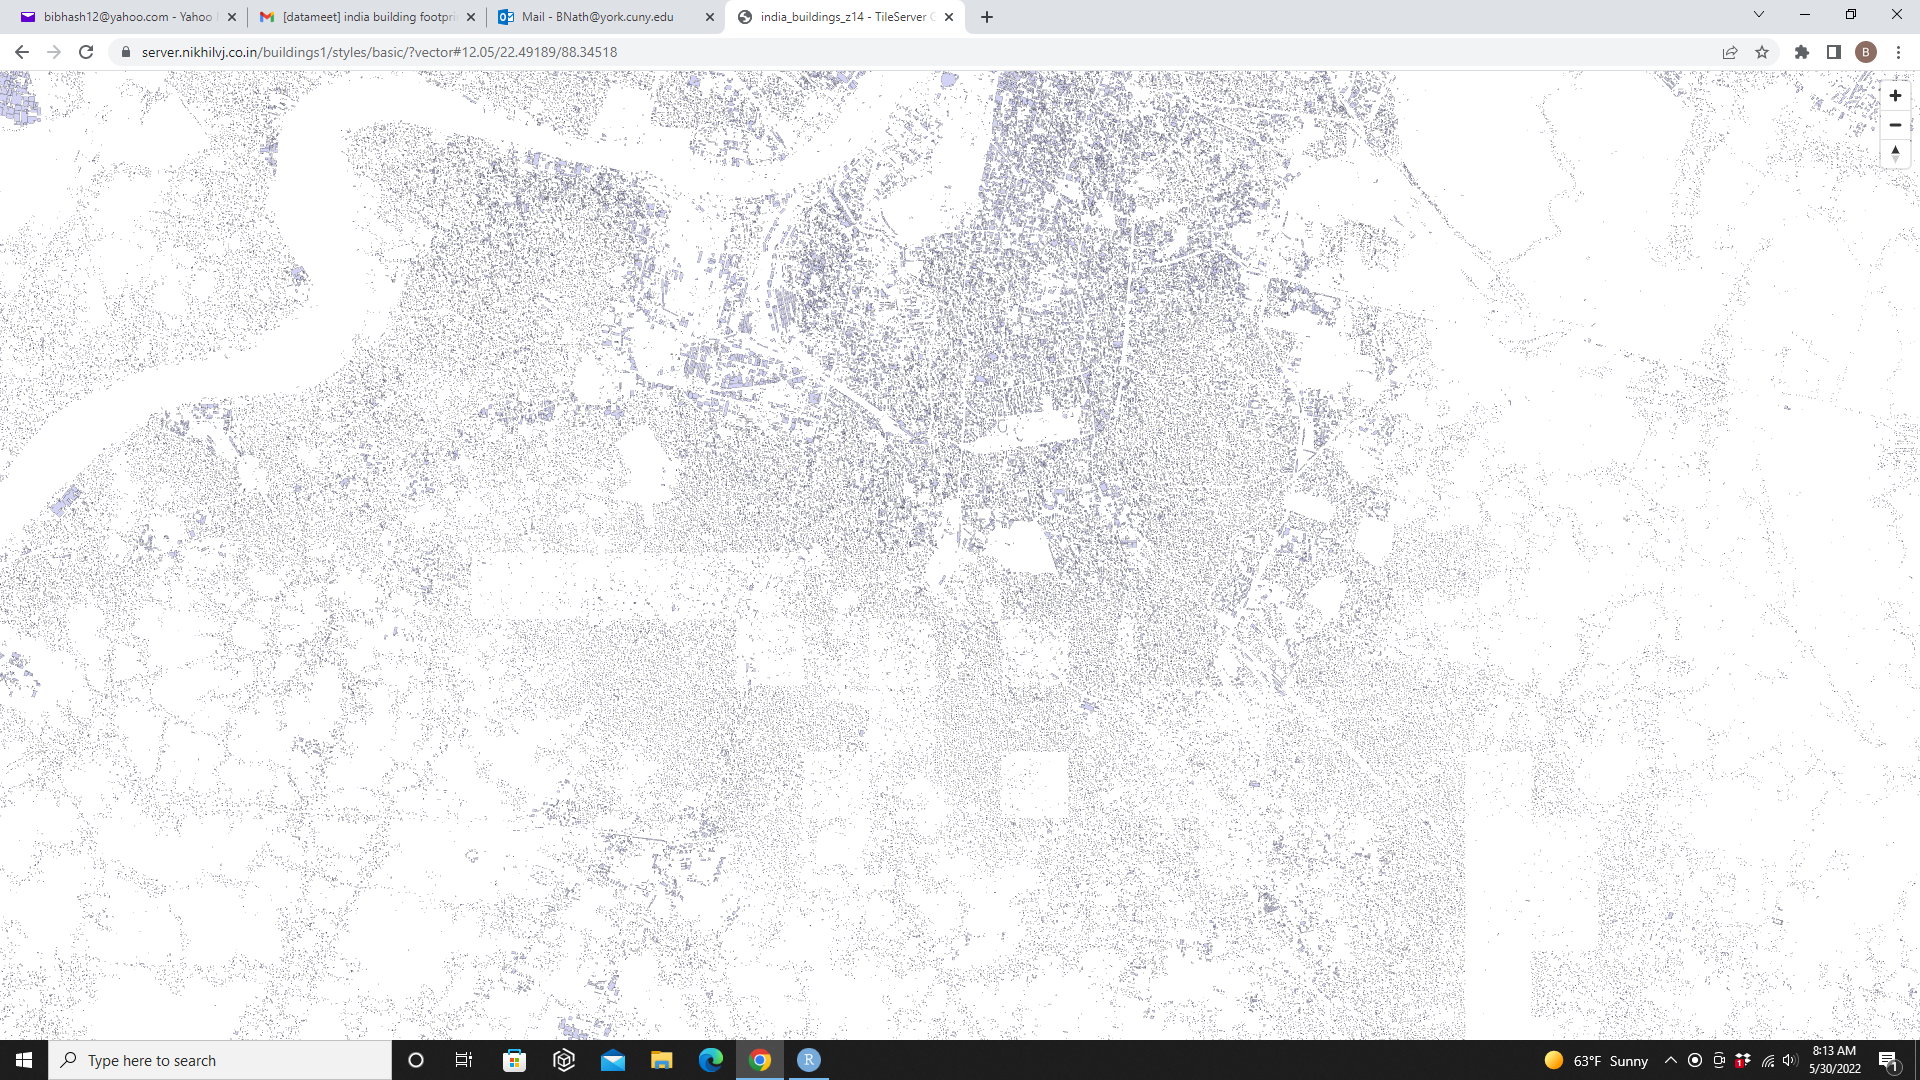
By the way I would like to add that in some areas the data is missing/not complete (I also found the same when I converted to gpkg from geojsonl).
Probably because this has happened due to a satellite image issue -- an example from the Kolkata city region.
Best,
Bibhash
To view this discussion on the web visit https://groups.google.com/d/msgid/datameet/CAH7jeuPi2aX0ruuLHobpdZWqCayqfKSGFd66yo8BcncxfhrgqA%40mail.gmail.com.
Deepak Sharda
May 30, 2022, 11:31:15 PM5/30/22
to data...@googlegroups.com
Thanks Nikhil for doing good work for community.
You can make building in 3d view.
There are two ways to do that
1. Adding building height data from contour and using deck gl or three gs to show in 3d.
2. 3d building view with vector styling. It gives 3d view but all building will be similar height. Although it is really nice when you look into a mobile or web app
Note . Nit lit of work for 2nd option. You just need to make few changes in style file.
Regards
To view this discussion on the web visit https://groups.google.com/d/msgid/datameet/CAH7jeuPi2aX0ruuLHobpdZWqCayqfKSGFd66yo8BcncxfhrgqA%40mail.gmail.com.
nikh...@gmail.com
Aug 10, 2023, 3:39:43 AM8/10/23
to datameet
Hello,
There's been a building footprints data release by Google recently, I didn't find any post on datameet for it yet (or maybe I didn't look properly) so posting under this thread.
You can read all about it and download at this link:
One good thing here that wasn't there in the Microsoft data release : Confidence level values attached with each shape. So one can filter out the ones with lower values or color them differently to indicate lower certainty.
Another good thing : The data is a lot more dense than what we had in Microsoft's release.
They have given grid-wise downloads which IMHO are still too big, spanning whole states.
I've written a basic script in python for extracting a limited region's data, sharing here:
Kindly read the instructions carefully before using. And you can add comments at bottom if you face any problem.
Regards
Nikhil
Reply all
Reply to author
Forward
0 new messages