D3.js v5 - Creating a relative, zoomable timeline-like axis on a linear scale

Samuel
I need to create a relative timeline-like axis in D3 (v5) that is zoomable and changes units and tick intervals on zoom change. It will be used for planning certain activities in time relative to the baseline - value 0.
Example Timepoints: at -8 days, 2 hrs, 10 & 20 days, 2 & 4 & 6 weeks, 4 months and so on (stored in millisecond offsets).
When zoomed out, the ticks would be formatted as years, and as the user begins to zoom in, these turn to months, then weeks, days, hours, down to the minutes.
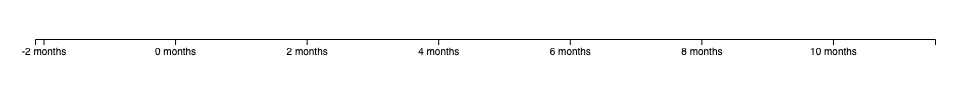
The example shows the approximate effect that I am going for (use the mousewheel scroll to zoom in or out on the axis).
I decided to use a linear scale with integer units - representing milliseconds. I am using tickFormat() where I find the distance among the ticks and calculate different tick formats based on that.
I probably cannot use D3’s scaleTime() because that’s based on real calendar dates (with variable months, gap years, etc). I need a fixed scale of offsets - 24-hour days, 7-day weeks, 30-day months, 365-days years.
The scale in the example is wrong - D3 generates the ticks automatically in nicely rounded values - and I need the tick intervals to be variable based on the zoom level. Meaning, when showing ticks in the format of months, the distance between 2 ticks should be one month (in ms) and when zooming down to hours, the distance between 2 ticks should be exactly one hour (in ms) and so on.
I guess I will need to create some algorithm that generates the variable ticks but I am not sure how would it look like, and what are the limitations of the D3 API because I haven't found any methods that would allow for something like this. I couldn't find any examples of this effect anywhere and I was hoping that someone here could point me in the right direction or give some tips on how to achieve it.

Ger Hobbelt
height = 200,
margin = 50
const DateTime = luxon.DateTime;
let last_daystr = null;
const zoom = d3.zoom()
.scaleExtent( [ 1, 10000 ] )
.translateExtent([[0, 0], [width, height]])
.on( 'zoom', () => onZoom() )
const svg = d3.select( '#d3' )
.append( 'svg' )
.attr( 'width', width )
.attr( 'height', height )
.attr( 'viewBox', `0 0 ${ width } ${ height }` )
.call( zoom )
const base0timestampRightNow = new Date();
// produces timestamp for LOCAL date @ 24:00 hours
// (last midnight)
function dateToMidnight(d) {
let tz_offset = d.getTimezoneOffset();
tz_offset *= 60000;
return new Date(d.getFullYear(), d.getMonth(), d.getDate()).getTime() - tz_offset;
};
const base0timestamp = dateToMidnight(base0timestampRightNow);
console.log("ZERO DATE:", base0timestamp, new Date(base0timestamp));
function offsetToDate(offset) {
const t = base0timestamp + offset;
return new Date(t);
}
function dateToOffset(d) {
const t = d.getTime() - base0timestamp;
return t;
}
function dateNiceToStartOfMonth(d) {
// d3.timeMonth() works in UTC, hence doesn't do exactly what I want
const d1 = new Date(d.getUTCFullYear(), d.getUTCMonth(), 1);
let tz_offset = d1.getTimezoneOffset();
tz_offset *= 60000;
return new Date(d1.getTime() - tz_offset);
}
console.log("Offset test:", offsetToDate(37.5*3600*1000), dateToOffset(offsetToDate(37.5*3600*1000)) === 37.5*3600*1000 ? "OK" : "!FAIL!");
console.log("DOMAIN RAW:", offsetToDate(-2.628e9), offsetToDate(3.154e10))
console.log("DOMAIN NICE:", dateNiceToStartOfMonth(offsetToDate(-2.628e9)), dateNiceToStartOfMonth(offsetToDate(3.154e10)))
const x = d3.scaleTime()
.domain([dateNiceToStartOfMonth(offsetToDate(-2.628e9)), dateNiceToStartOfMonth(offsetToDate(3.154e10))])
.range([ margin, width-margin ])
.nice()
const xAxis = d3.axisBottom()
.scale( x )
.tickFormat( tickFormat )
const g = svg.append("g")
.attr("class", "axis axis--x")
.call( xAxis )
g.selectAll("text")
.style("text-anchor", "end")
.attr("dx", "-.8em")
.attr("dy", ".15em")
.attr("transform", "rotate(-75)");
function onZoom() {
const t = d3.event.transform,
xt = t.rescaleX( x );
g.call( xAxis.scale(xt) )
g.selectAll("text")
.style("text-anchor", "end")
.attr("dx", "-.8em")
.attr("dy", ".15em")
.attr("transform", "rotate(-75)");
}
function round(v, mult) {
v *= mult;
v = Math.round(v);
return v / mult;
}
function tickFormat(val, idx, ticksArray) {
//console.log(arguments)
//const delta = dateToOffset(val);
//let dist = Math.abs(delta);
//if (dist < 5000)
// return `${delta}ms`;
//if (dist < 2 * 60 * 1000)
// return `${round(delta / 1000, 20)}s`;
//if (dist < 2 * 3600 * 1000)
// return `${round(delta / (3600 * 1000), 20)}m`;
//if (dist < 24 * 3600 * 1000)
// return `${round(delta / (24 * 3600 * 1000), 2)}d`;
// RESET the hacky "don't repeat date in ticks" monitor
// code when we discover we're re-rendering the ticks:
// This results in the left-most tick always carrying
// the date, next to the time, no matter how far you zoom in.
if (idx === 0)
last_daystr = null;
// don't keep repeating the same day over and over in the ticks
let fmt = d3.timeFormat("%Y %b %-d");
let fmt_type = 1;
let daystr = fmt(val);
if (daystr === last_daystr) {
fmt = d3.timeFormat("%H:%M:%S");
fmt_type = 3;
}
else {
// don't print 00:00:00 time when we do print the date:
if (val.getHours() === 0 && val.getMinutes() === 0 && val.getSeconds() === 0 && val.getMilliseconds() === 0) {
fmt = d3.timeFormat("%Y %b %-d");
fmt_type = 1;
}
else {
fmt = d3.timeFormat("%Y %b %-d %H:%M:%S");
fmt_type = 2;
}
last_daystr = daystr;
}
let valstr = fmt(val);
if (0) {
// Rough example to tweak ticks for today/tomorrow/yesterday:
if (fmt_type < 3) {
let d0 = dateToMidnight(val);
//console.log("Day compare:", new Date(d0), new Date(base0timestamp), d0 === base0timestamp)
if (d0 === base0timestamp) {
if (fmt_type === 1)
valstr = "(today)";
else {
fmt = d3.timeFormat("(today) %H:%M:%S");
valstr = fmt(val);
}
}
else if (d0 === base0timestamp + 24 * 3600 * 1000) {
if (fmt_type === 1)
valstr = "(tomorrow)";
else {
fmt = d3.timeFormat("(tomorrow) %H:%M:%S");
valstr = fmt(val);
}
}
else if (d0 === base0timestamp - 24 * 3600 * 1000) {
if (fmt_type === 1)
valstr = "(yesterday)";
else {
fmt = d3.timeFormat("(yesterday) %H:%M:%S");
valstr = fmt(val);
}
}
}
}
else {
// Example using LUXON for printing relative ticks:
let dt = DateTime.fromJSDate(val);
let relstr = dt.toRelative({
base: DateTime.fromMillis(base0timestamp)
});
if (idx === 0) {
valstr = `${relstr}: ${valstr}`;
}
else if (idx === ticksArray.length - 1 && fmt_type < 3) {
// print date at end of range as it will be different
valstr = `${relstr}: ${valstr}`;
}
else {
// calculate timespan of shown scale:
let d1 = ticksArray[0].__data__;
let d2 = ticksArray[ticksArray.length - 1].__data__;
//console.log({d1, d2, idx, ticksArray})
const delta1 = dateToOffset(d1);
const delta2 = dateToOffset(d2);
let dist1 = Math.abs(delta1);
let dist2 = Math.abs(delta2);
let span = Math.abs(delta1 - delta2);
//console.log({span, dist1, dist2, d1, d2, delta1, delta2})
if (span <= 14 * 24 * 3600 * 1000 &&
dist1 <= 7 * 24 * 3600 * 1000 &&
dist2 <= 7 * 24 * 3600 * 1000) {
// we're looking at a 7 day range close to ZERO BASE:
// reckon in hours/minutes/... then!
let relstr = dt.toRelative({
//base: DateTime.fromMillis(base0timestamp),
unit: (span < 35 * 60 * 1000 ? "seconds" :
span < 35 * 3600 * 1000 ? "minutes" :
"hours")
});
valstr = `${relstr}: ${valstr}`;
}
}
}
return `${valstr}`;
//return `${round(delta / (24 * 3600 * 1000), 1)} days`;
}
Ger Hobbelt
--------------------------------------------------
web: http://www.hobbelt.com/
http://www.hebbut.net/
mail: g...@hobbelt.com
mobile: +31-6-11 120 978
--------------------------------------------------
--
You received this message because you are subscribed to the Google Groups "d3-js" group.
To unsubscribe from this group and stop receiving emails from it, send an email to d3-js+un...@googlegroups.com.
To view this discussion on the web visit https://groups.google.com/d/msgid/d3-js/a052bb22-b4bb-4035-aac7-8634f77d5f41n%40googlegroups.com.
Ger Hobbelt
Ger Hobbelt
--------------------------------------------------
web: http://www.hobbelt.com/
http://www.hebbut.net/
mail: g...@hobbelt.com
mobile: +31-6-11 120 978
--------------------------------------------------
--