ClueGO : will it be possible to display %Genes/term in the pie chart in results of analysis section
706 views
Skip to first unread message

BIOMICS
Nov 22, 2017, 8:05:27 AM11/22/17
to cytoscape-helpdesk
Hi All,
While performing CLueGO analysis, in the results of analysis tab under cluster section we can see the bar chart also we have in the x-axis name as %Genes/term. However in the pie chart continuing with it there is no display of % for each category (group).
I request help if it is possible to display each category (group) name along with the % value for pie chart also.
Thanks,
Nara

Bernhard
Nov 22, 2017, 8:38:08 AM11/22/17
to cytoscape...@googlegroups.com
Hi Nara, the overview pie chart shown at the moment summarizes the number of terms per group. So what you want to see is the percentage of the group size compared to the total? We could add also a pie chart that summarizes the total number of unique genes per group.
Best
Best
Narasimhan Kothandaraman
Nov 22, 2017, 9:28:04 AM11/22/17
to cytoscape...@googlegroups.com
Hi Bernhard, I'm able to see the pie chart. However I like to add % Genes/term for each section in the pie chart.
Thanks
Nara
On Wednesday, 22 November 2017, 21:38, Bernhard <gabriel...@gmail.com> wrote:
Hi Nara, the overview pie chart shown at the moment summarizes the number of terms per group. What we could add is a pie chart that summarizes the total number of unique genes per group. Is it that what you want to display?
Best
On Wednesday, November 22, 2017 at 2:05:27 PM UTC+1, BIOMICS wrote:
Hi All,While performing CLueGO analysis, in the results of analysis tab under cluster section we can see the bar chart also we have in the x-axis name as %Genes/term. However in the pie chart continuing with it there is no display of % for each category (group).I request help if it is possible to display each category (group) name along with the % value for pie chart also.Thanks,Nara
--
You received this message because you are subscribed to a topic in the Google Groups "cytoscape-helpdesk" group.
To unsubscribe from this topic, visit https://groups.google.com/d/topic/cytoscape-helpdesk/Eky8Z_okvv8/unsubscribe.
To unsubscribe from this group and all its topics, send an email to cytoscape-helpd...@googlegroups.com.
To post to this group, send email to cytoscape...@googlegroups.com.
Visit this group at https://groups.google.com/group/cytoscape-helpdesk.
To view this discussion on the web visit https://groups.google.com/d/msgid/cytoscape-helpdesk/9c19b8e5-f9f1-46df-8d20-d38c00a6bc9d%40googlegroups.com.
Bernhard
Nov 23, 2017, 4:46:40 AM11/23/17
to cytoscape-helpdesk
Hi Nara, we will add this to our next release.
Best
Best
On Wednesday, November 22, 2017 at 3:28:04 PM UTC+1, BIOMICS wrote:
Hi Bernhard, I'm able to see the pie chart. However I like to add % Genes/term for each section in the pie chart.ThanksNara
Hi Nara, the overview pie chart shown at the moment summarizes the number of terms per group. What we could add is a pie chart that summarizes the total number of unique genes per group. Is it that what you want to display?--
Best
On Wednesday, November 22, 2017 at 2:05:27 PM UTC+1, BIOMICS wrote:Hi All,While performing CLueGO analysis, in the results of analysis tab under cluster section we can see the bar chart also we have in the x-axis name as %Genes/term. However in the pie chart continuing with it there is no display of % for each category (group).I request help if it is possible to display each category (group) name along with the % value for pie chart also.Thanks,Nara
You received this message because you are subscribed to a topic in the Google Groups "cytoscape-helpdesk" group.
To unsubscribe from this topic, visit https://groups.google.com/d/topic/cytoscape-helpdesk/Eky8Z_okvv8/unsubscribe.
To unsubscribe from this group and all its topics, send an email to cytoscape-helpdesk+unsub...@googlegroups.com.
Nara K
Nov 23, 2017, 5:46:44 AM11/23/17
to cytoscape...@googlegroups.com
Hi Bernhard,
Thanks
With the available dates is it possible to calculate the % values manually, please let me know.
Regards, Nara
On 23 Nov 2017 5:46 PM, "Bernhard" <gabriel...@gmail.com> wrote:
Hi Nara, we will add this to our next release.
Best
On Wednesday, November 22, 2017 at 3:28:04 PM UTC+1, BIOMICS wrote:
Hi Bernhard, I'm able to see the pie chart. However I like to add % Genes/term for each section in the pie chart.ThanksNara
Hi Nara, the overview pie chart shown at the moment summarizes the number of terms per group. What we could add is a pie chart that summarizes the total number of unique genes per group. Is it that what you want to display?--
Best
On Wednesday, November 22, 2017 at 2:05:27 PM UTC+1, BIOMICS wrote:Hi All,While performing CLueGO analysis, in the results of analysis tab under cluster section we can see the bar chart also we have in the x-axis name as %Genes/term. However in the pie chart continuing with it there is no display of % for each category (group).I request help if it is possible to display each category (group) name along with the % value for pie chart also.Thanks,Nara
You received this message because you are subscribed to a topic in the Google Groups "cytoscape-helpdesk" group.
To unsubscribe from this topic, visit https://groups.google.com/d/topic/cytoscape-helpdesk/Eky8Z_okvv8/unsubscribe.
To unsubscribe from this group and all its topics, send an email to cytoscape-helpdesk+unsubscribe@googlegroups.com.
To post to this group, send email to cytoscape...@googlegroups.com.
Visit this group at https://groups.google.com/group/cytoscape-helpdesk.
To view this discussion on the web visit https://groups.google.com/d/msgid/cytoscape-helpdesk/9c19b8e5-f9f1-46df-8d20-d38c00a6bc9d%40googlegroups.com.
--
You received this message because you are subscribed to a topic in the Google Groups "cytoscape-helpdesk" group.
To unsubscribe from this topic, visit https://groups.google.com/d/topic/cytoscape-helpdesk/Eky8Z_okvv8/unsubscribe.
To unsubscribe from this group and all its topics, send an email to cytoscape-helpdesk+unsub...@googlegroups.com.
To post to this group, send email to cytoscape-helpdesk@googlegroups.com.
Visit this group at https://groups.google.com/group/cytoscape-helpdesk.
To view this discussion on the web visit https://groups.google.com/d/msgid/cytoscape-helpdesk/b8375e2a-7d7b-4324-ac50-0cb3f2aa33f4%40googlegroups.com.
Bernhard
Nov 23, 2017, 6:48:43 AM11/23/17
to cytoscape-helpdesk
Hi Nara, I put a latest development version here:
http://www.ici.upmc.fr/cluego-plugin-2.5.1.jar
http://www.ici.upmc.fr/cluepedia-plugin-1.5.1.jar
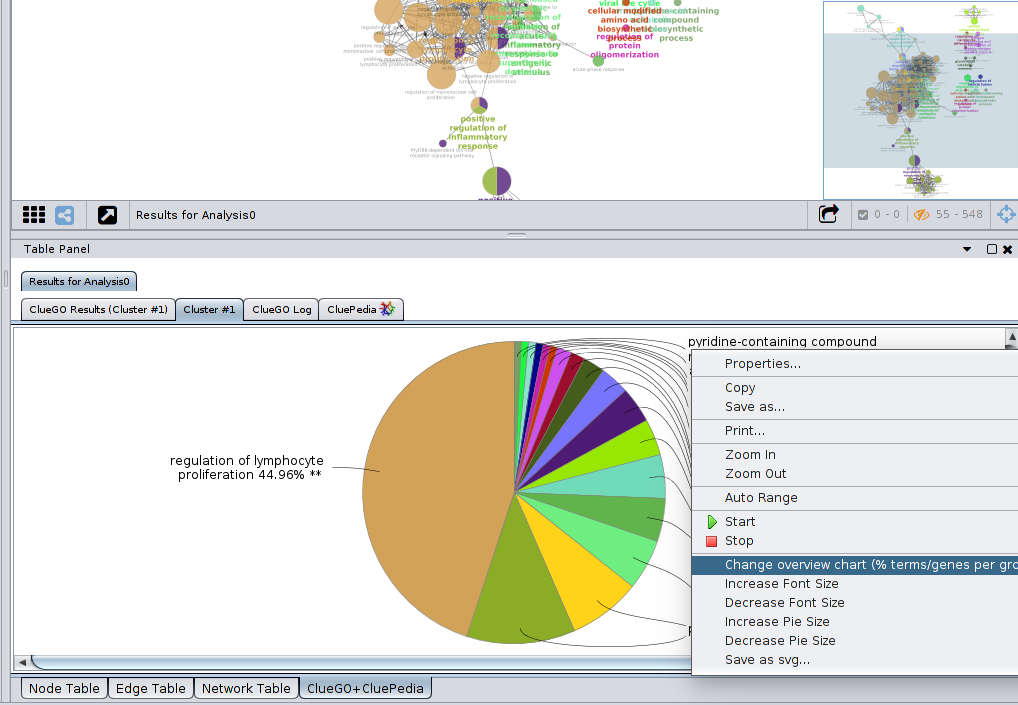
Just to keep you current files, make copy the folder v2.5.0 to a new folder v.2.5.1 before you install the new plugins (install them from file in the 'App manager' after you downloaded them). This makes sure that you have all your files in the newer version as well. Let me know if it is what you want. The show gene percentage per group pie chart you can toggle using the right mouse button on the graph and select ''Change overview chart ..." see down the screen shot.
Best
http://www.ici.upmc.fr/cluego-plugin-2.5.1.jar
http://www.ici.upmc.fr/cluepedia-plugin-1.5.1.jar
Just to keep you current files, make copy the folder v2.5.0 to a new folder v.2.5.1 before you install the new plugins (install them from file in the 'App manager' after you downloaded them). This makes sure that you have all your files in the newer version as well. Let me know if it is what you want. The show gene percentage per group pie chart you can toggle using the right mouse button on the graph and select ''Change overview chart ..." see down the screen shot.
Best
On Thursday, November 23, 2017 at 11:46:44 AM UTC+1, BIOMICS wrote:
Hi Bernhard,ThanksWith the available dates is it possible to calculate the % values manually, please let me know.Regards, Nara
On 23 Nov 2017 5:46 PM, "Bernhard" <gabriel...@gmail.com> wrote:
Hi Nara, we will add this to our next release.
Best
On Wednesday, November 22, 2017 at 3:28:04 PM UTC+1, BIOMICS wrote:
Hi Bernhard, I'm able to see the pie chart. However I like to add % Genes/term for each section in the pie chart.ThanksNara
Hi Nara, the overview pie chart shown at the moment summarizes the number of terms per group. What we could add is a pie chart that summarizes the total number of unique genes per group. Is it that what you want to display?--
Best
On Wednesday, November 22, 2017 at 2:05:27 PM UTC+1, BIOMICS wrote:Hi All,While performing CLueGO analysis, in the results of analysis tab under cluster section we can see the bar chart also we have in the x-axis name as %Genes/term. However in the pie chart continuing with it there is no display of % for each category (group).I request help if it is possible to display each category (group) name along with the % value for pie chart also.Thanks,Nara
You received this message because you are subscribed to a topic in the Google Groups "cytoscape-helpdesk" group.
To unsubscribe from this topic, visit https://groups.google.com/d/topic/cytoscape-helpdesk/Eky8Z_okvv8/unsubscribe.
To unsubscribe from this group and all its topics, send an email to cytoscape-helpdesk+unsub...@googlegroups.com.
To post to this group, send email to cytoscape...@googlegroups.com.
Visit this group at https://groups.google.com/group/cytoscape-helpdesk.
To view this discussion on the web visit https://groups.google.com/d/msgid/cytoscape-helpdesk/9c19b8e5-f9f1-46df-8d20-d38c00a6bc9d%40googlegroups.com.
--
You received this message because you are subscribed to a topic in the Google Groups "cytoscape-helpdesk" group.
To unsubscribe from this topic, visit https://groups.google.com/d/topic/cytoscape-helpdesk/Eky8Z_okvv8/unsubscribe.
To unsubscribe from this group and all its topics, send an email to cytoscape-helpdesk+unsub...@googlegroups.com.
To post to this group, send email to cytoscape...@googlegroups.com.
Visit this group at https://groups.google.com/group/cytoscape-helpdesk.
Narasimhan Kothandaraman
Nov 23, 2017, 8:49:22 AM11/23/17
to cytoscape...@googlegroups.com
Hi Bernhard,
It perfectly worked. Many thanks
Nara
To view this discussion on the web visit https://groups.google.com/d/ msgid/cytoscape-helpdesk/ b8375e2a-7d7b-4324-ac50- 0cb3f2aa33f4%40googlegroups. com.
For more options, visit https://groups.google.com/d/ optout.
--
You received this message because you are subscribed to a topic in the Google Groups "cytoscape-helpdesk" group.
To unsubscribe from this topic, visit https://groups.google.com/d/topic/cytoscape-helpdesk/Eky8Z_okvv8/unsubscribe.
You received this message because you are subscribed to a topic in the Google Groups "cytoscape-helpdesk" group.
To unsubscribe from this topic, visit https://groups.google.com/d/topic/cytoscape-helpdesk/Eky8Z_okvv8/unsubscribe.
To unsubscribe from this group and all its topics, send an email to cytoscape-helpd...@googlegroups.com.
To post to this group, send email to cytoscape...@googlegroups.com.
Visit this group at https://groups.google.com/group/cytoscape-helpdesk.
To view this discussion on the web visit https://groups.google.com/d/msgid/cytoscape-helpdesk/21d6ee34-5c48-4da5-ab6c-b13eec96b008%40googlegroups.com.
Narasimhan Kothandaraman
Mar 7, 2018, 12:37:01 PM3/7/18
to cytoscape...@googlegroups.com, Bernhard, Gabriela Bindea
Hi Bernhard,
Just to clarify, the asterisk sign (**) marks next to the % values in the pie chart does it indicates the p-values. Is it correct to say the following if indicates the p-values?
Single (*) or double (**) asterisk indicate significant enriched GO terms at the p < 0.05 and p < 0.01 statistical levels, respectively.
On another note even if I don't select "Show only pathways with pV <_ 0.05", the asterisk sign appears in the pie chart. Is it independent of the selection?
Please clarify.
Thank you,
Nara
To view this discussion on the web visit https://groups.google.com/d/ msgid/cytoscape-helpdesk/ 9c19b8e5-f9f1-46df-8d20- d38c00a6bc9d%40googlegroups. com.
For more options, visit https://groups.google.com/d/ optout.
--
You received this message because you are subscribed to a topic in the Google Groups "cytoscape-helpdesk" group.
To unsubscribe from this topic, visit https://groups.google.com/d/ topic/cytoscape-helpdesk/ Eky8Z_okvv8/unsubscribe.
To unsubscribe from this group and all its topics, send an email to cytoscape-helpdesk+ unsub...@googlegroups.com.
To post to this group, send email to cytoscape...@ googlegroups.com.
Visit this group at https://groups.google.com/ group/cytoscape-helpdesk.
To view this discussion on the web visit https://groups.google.com/d/ msgid/cytoscape-helpdesk/ b8375e2a-7d7b-4324-ac50- 0cb3f2aa33f4%40googlegroups. com.
For more options, visit https://groups.google.com/d/ optout.
--
You received this message because you are subscribed to a topic in the Google Groups "cytoscape-helpdesk" group.
To unsubscribe from this topic, visit https://groups.google.com/d/topic/cytoscape-helpdesk/Eky8Z_okvv8/unsubscribe.
You received this message because you are subscribed to a topic in the Google Groups "cytoscape-helpdesk" group.
To unsubscribe from this topic, visit https://groups.google.com/d/topic/cytoscape-helpdesk/Eky8Z_okvv8/unsubscribe.
To unsubscribe from this group and all its topics, send an email to cytoscape-helpd...@googlegroups.com.
To post to this group, send email to cytoscape...@googlegroups.com.
Visit this group at https://groups.google.com/group/cytoscape-helpdesk.
To view this discussion on the web visit https://groups.google.com/d/msgid/cytoscape-helpdesk/21d6ee34-5c48-4da5-ab6c-b13eec96b008%40googlegroups.com.
Bernhard
Mar 7, 2018, 7:32:55 PM3/7/18
to cytoscape-helpdesk
Hi Nara,
On Wednesday, March 7, 2018 at 6:37:01 PM UTC+1, BIOMICS wrote:
Hi Bernhard,
Just to clarify, the asterisk sign (**) marks next to the % values in the pie chart does it indicates the p-values. Is it correct to say the following if indicates the p-values?Single (*) or double (**) asterisk indicate significant enriched GO terms at the p < 0.05 and p < 0.01 statistical levels, respectively.
Yes this is correct.
On another note even if I don't select "Show only pathways with pV <_ 0.05", the asterisk sign appears in the pie chart. Is it independent of the selection?
Yes it is independent of the selection.
Please clarify.Thank you,Nara
Best
To unsubscribe from this group and all its topics, send an email to cytoscape-helpdesk+unsub...@googlegroups.com.
Narasimhan Kothandaraman
Mar 7, 2018, 7:35:32 PM3/7/18
to cytoscape...@googlegroups.com
Many thanks, Bernhard.
Nara
To view this discussion on the web visit https://groups.google.com/d/ msgid/cytoscape-helpdesk/ 21d6ee34-5c48-4da5-ab6c- b13eec96b008%40googlegroups. com.
--
You received this message because you are subscribed to a topic in the Google Groups "cytoscape-helpdesk" group.
To unsubscribe from this topic, visit https://groups.google.com/d/topic/cytoscape-helpdesk/Eky8Z_okvv8/unsubscribe.
You received this message because you are subscribed to a topic in the Google Groups "cytoscape-helpdesk" group.
To unsubscribe from this topic, visit https://groups.google.com/d/topic/cytoscape-helpdesk/Eky8Z_okvv8/unsubscribe.
To unsubscribe from this group and all its topics, send an email to cytoscape-helpd...@googlegroups.com.
To post to this group, send email to cytoscape...@googlegroups.com.
Visit this group at https://groups.google.com/group/cytoscape-helpdesk.
To view this discussion on the web visit https://groups.google.com/d/msgid/cytoscape-helpdesk/732ecc36-bbdc-40d0-8271-bdb86c65efe0%40googlegroups.com.

ca...@miamioh.edu
Mar 23, 2018, 3:26:31 PM3/23/18
to cytoscape-helpdesk
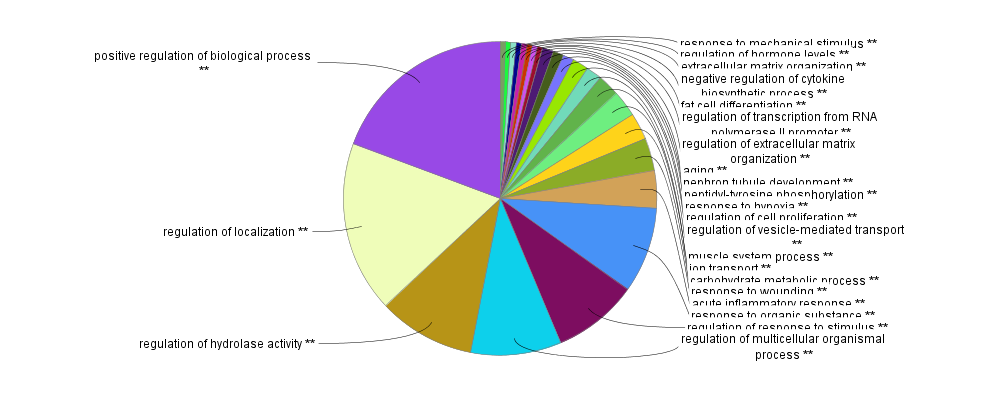
Good to clarify. Is there anybody know what is this pie chart based on (percentage of which)? Or if I can revise the figure (pie chart on biological process, attached) to remove some of the non-significant terms as the labels are squeezed and cannot read? Thanks,
Jingyi
To unsubscribe from this group and all its topics, send an email to cytoscape-helpdesk+unsub...@googlegroups.com.
Narasimhan Kothandaraman
Mar 23, 2018, 8:13:20 PM3/23/18
to cytoscape...@googlegroups.com
Yes, I too had a similar issue recently where I had to squeeze nearly 28 terms in a CluePedia pie chart. If there is a way to reduce this to less than 10 it would be very useful from a visualization purpose of the data and say we are only showing only 10 out of 20 significant "% of genes per term" or relevant details of the pie chart.
Many thanks,
Nara
From: "ca...@miamioh.edu" <ca...@miamioh.edu>
To: cytoscape-helpdesk <cytoscape...@googlegroups.com>
Sent: Saturday, 24 March 2018, 3:26
Subject: Re: [cytoscape-helpdesk] Re: ClueGO : will it be possible to display %Genes/term in the pie chart in results of analysis section
Good to clarify. Is there anybody know what is this pie chart based on (percentage of which)? Or if I can revise the figure (pie chart on biological process, attached) to remove some of the non-significant terms as the labels are squeezed and cannot read? Thanks,
Jingyi
On Wednesday, March 7, 2018 at 12:37:01 PM UTC-5, BIOMICS wrote:
Hi Bernhard,Just to clarify, the asterisk sign (**) marks next to the % values in the pie chart does it indicates the p-values. Is it correct to say the following if indicates the p-values?Single (*) or double (**) asterisk indicate significant enriched GO terms at the p < 0.05 and p < 0.01 statistical levels, respectively.On another note even if I don't select "Show only pathways with pV <_ 0.05", the asterisk sign appears in the pie chart. Is it independent of the selection?Please clarify.Thank you,Nara
Hi Nara, I put a latest development version here:
To view this discussion on the web visit https://groups.google.com/d/ msgid/cytoscape-helpdesk/ 21d6ee34-5c48-4da5-ab6c- b13eec96b008%40googlegroups. com.
--
You received this message because you are subscribed to a topic in the Google Groups "cytoscape-helpdesk" group.
To unsubscribe from this topic, visit https://groups.google.com/d/topic/cytoscape-helpdesk/Eky8Z_okvv8/unsubscribe.
You received this message because you are subscribed to a topic in the Google Groups "cytoscape-helpdesk" group.
To unsubscribe from this topic, visit https://groups.google.com/d/topic/cytoscape-helpdesk/Eky8Z_okvv8/unsubscribe.
To unsubscribe from this group and all its topics, send an email to cytoscape-helpd...@googlegroups.com.
To post to this group, send email to cytoscape...@googlegroups.com.
Visit this group at https://groups.google.com/group/cytoscape-helpdesk.
To view this discussion on the web visit https://groups.google.com/d/msgid/cytoscape-helpdesk/d669d284-cc72-4f74-883d-53fe8d90ddfb%40googlegroups.com.
Bernhard
Mar 24, 2018, 5:36:20 AM3/24/18
to cytoscape-helpdesk
Hi, the only way to have a smaller pie chart at the moment is to run a
more restrictive analysis so that you end up with less groups and only
the most significany terms. The pie and the label size can be changed by clicking on the right mouse button an in/decrease the size.
Best
Best
To unsubscribe from this group and all its topics, send an email to cytoscape-helpdesk+unsub...@googlegroups.com.
ca...@miamioh.edu
Mar 24, 2018, 12:30:09 PM3/24/18
to cytoscape-helpdesk
Thanks Bernhard! One more question, would you know how to export the pie chart figure in a higher resolution?
Best,
Jingyi
Bernhard
Mar 24, 2018, 6:25:04 PM3/24/18
to cytoscape-helpdesk
Hi Jingyi, if you click on the right mouse button on the image you should get the option to save the image as svg, so you can scale it afterwards as large as you want.
Best
Best

emilian...@gmail.com
Jul 31, 2018, 7:24:12 PM7/31/18
to cytoscape-helpdesk
Il giorno mercoledì 22 novembre 2017 14:38:08 UTC+1, Bernhard ha scritto:
> Hi Nara, the overview pie chart shown at the moment summarizes the number of terms per group. So what you want to see is the percentage of the group size compared to the total? We could add also a pie chart that summarizes the total number of unique genes per group.
> Best
Dear Bernhard, I really liked the possibility to add the % in the pie charts; however, it is still not clear to me how this value is calculated.
> Hi Nara, the overview pie chart shown at the moment summarizes the number of terms per group. So what you want to see is the percentage of the group size compared to the total? We could add also a pie chart that summarizes the total number of unique genes per group.
> Best
I would indeed like to see the percentage of unique genes in each group compared to the total input genes number. However, at the moment, this value does not seem to be calculated in that way and I can't figure out what it truely represents.
Thank you very much for your help,
Emiliano.
Bernhard
Aug 9, 2018, 2:58:07 PM8/9/18
to cytoscape-helpdesk
Hi Emiliano,
please see bellow an example calculation for the pie chart with the number of genes for a ClueGO-CluePedia term-gene network. Please note that shared genes between groups are included in each of the groups.
Let us know if you have other questions.
Best
Le mercredi 1 août 2018 01:24:12 UTC+2, Emiliano Dalla a écrit :
> Il giorno mercoledì 22 novembre 2017 14:38:08 UTC+1, Bernhard ha scritto:
> > Hi Nara, the overview pie chart shown at the moment summarizes the number of terms per group. So what you want to see is the percentage of the group size compared to the total? We could add also a pie chart that summarizes the total number of unique genes per group.
> > Best
>
> Dear Bernhard, I really liked the possibility to add the % in the pie charts; however, it is still not clear to me how this value is calculated.
>
> I would indeed like to see the percentage of unique genes in each group compared to the total input genes number. However, at the moment, this value does not seem to be calculated in that way and I can't figure out what it truely represents.
>
> Thank you very much for your help,
> Emiliano.
Reply all
Reply to author
Forward
0 new messages