Home range estimation running extremely slowly
260 views
Skip to first unread message

Bethany Smith
May 11, 2022, 11:13:30 AM5/11/22
to ctmm R user group
Hi,
Sorry in advance for the long message...
I'm completely new to spatial analyses and the ctmm package, but have been working through the examples and writing / running my code for the last month or so. I have GPS tracking data from sheep and their associated guarding dogs and am trying to calculate their home ranges and overlaps between sheep-dog pairs. With the odd excursion observed, I would say all the individuals are range resident, as they return to the same place every evening after roaming surrounding pastures during the day.
The GPS tags I used are duty cycling, being programmed by the manufacturer to record a fix every 2-3 minutes whilst the animal is moving or every hour whilst the animal is stationary. Although the tags are set to record every 2-3 mins, they didn't really stick to this (I don't know why) and the minimum sampling intervals can be as little as a few seconds. As such, I have gone with using weights=TRUE in my code. However, I'm having a real issue with how long some of the calculations are taking and I can't seem to find a consistent reason for the length of time taken. As all of my test runs returned the OUF anisotropic model, I changed from using ctmm.select to ctmm.fit as I saw this recommended in another comment. This has sped up the code a small amount, but some still take days to run and from the trace I can see it is the home range estimation taking the time, not the model fitting.
The weird thing is that I just ran a group of animals from the same location in a loop, say Dog 1 (n=2475), Dog 2 (n=2436), Dog 3 (n=2555) and Sheep 1 (n=3228) together and it took 30 minutes to calculate the fits and home ranges, but then I ran Dog 4 (n=2747) and Sheep 1 together separately, and it took over 24 hours despite being a similar amount of data. I also have individuals from another location that has been running for 3 days already...
I have my code written as a function with a loop in it due to the structure of my data (12 locations with multiple individuals at each location):
hr_func <- function(myData, name) {
FITS <- AKDES <- list()
for(i in 1:length(myData)) {
GUESS <- ctmm.guess(myData[[i]], interactive=FALSE)
FITS[[i]] <- ctmm.fit(myData[[i]], GUESS, method = 'pHREML', trace = 2)
}
names(FITS) <- names(myData[1:length(myData)])
AKDES <- akde(myData, FITS, weights = TRUE, debias = TRUE, smooth = TRUE,
FITS <- AKDES <- list()
for(i in 1:length(myData)) {
GUESS <- ctmm.guess(myData[[i]], interactive=FALSE)
FITS[[i]] <- ctmm.fit(myData[[i]], GUESS, method = 'pHREML', trace = 2)
}
names(FITS) <- names(myData[1:length(myData)])
AKDES <- akde(myData, FITS, weights = TRUE, debias = TRUE, smooth = TRUE,
trace = 2)
HR_list <- list(FITS, AKDES)
saveRDS(HR_list, file = sprintf("../Results/HRs/hr_output_%s.rds", name))
return(HR_list)
}
HR_list <- list(FITS, AKDES)
saveRDS(HR_list, file = sprintf("../Results/HRs/hr_output_%s.rds", name))
return(HR_list)
}
Am I doing something stupid / wrong somewhere? Any help would be greatly appreciated!
Many thanks,
Beth

Christen Fleming
May 12, 2022, 1:33:50 PM5/12/22
to ctmm R user group
Hi Beth,
FYI, when analyzing data that stops recording when the animal is not moving, and that acceleration information is not accounted for in the movement model, then this induces a bias in the results where you overestimate speed and under estimate velocity correlation, because the model thinks that the individual moves just as much when data are not being collected.
You might take a look at my followup post to the other user having computation time issues with weights=TRUE. In their situation, it was just a matter of plotting the sampling intervals and identifying an appropriate time-step argument (dt) for the grid. Their sampling schedule was sufficiently complex so that neither the minimum nor the median time intervals would make great choices. Otherwise I can take a look at a data example if you are still having issues.
The computation time with weights=TRUE and fast=TRUE is proportional to the total period of the data divided by dt, which could differ from the number of locations if there are large gaps in the data. With datasets on the order of only 2k-3k locations, it may be the case that the more exact fast=FALSE, PC='direct' algorithm is fast enough and save yourself from fiddling with dt.
Also, with occasional tiny sampling intervals, I would highly recommend a location error model in your case as well.
Best,
Chris
Christen Fleming
May 13, 2022, 3:33:00 PM5/13/22
to Bethany Smith, ctmm R user group
Hi Beth,
You could either thin the data (even better) supply a prior, like this:
uere(DATA) <- 50 # 50 meter error
UERE <- uere(DATA)
UERE$DOF[] <- 2 # provide uncertainty
summary(UERE) # inspect CI
uere(DATA) <- UERE # assign
UERE <- uere(DATA)
UERE$DOF[] <- 2 # provide uncertainty
summary(UERE) # inspect CI
uere(DATA) <- UERE # assign
Best,
Chris
On Fri, May 13, 2022 at 12:19 PM Bethany Smith <betha...@gmail.com> wrote:
Hi Christen,Got it, thanks so much for explaining how that works.Just last quick question - if collecting calibration data isn't an option (no longer at the field site / no longer have access to the equipment), would thinning the data to remove those sub-minute data points help or is that just masking the problem?Thanks!BethOn Fri, May 13, 2022 at 5:07 PM Christen Fleming <chris.h...@gmail.com> wrote:Hi Bethany,fast=TRUE is an approximation of fast=FALSE, so if fast=FALSE is working well, then I would stick with that. fast=FALSE does not require or use the dt argument.If you were to run with fast=TRUE, then you would want to identify and use that ~2:30 sampling interval.If you've already run a bunch with fast=TRUE, then it would have probably been good as long as automated dt came out to be a divisor of that ~2:30 sampling interval. The default setting isn't the median.The weights would probably help with the density estimation for that kind of data, but the speed estimates will only correspond to the active time periods.You could consider collecting some calibration data in a representable environment(s) and using that to fix the errors. You just need something reasonable to take care of those few sub-minute data points.Best,ChrisOn Fri, May 13, 2022 at 11:38 AM Bethany Smith <betha...@gmail.com> wrote:Hi Christen,Thanks so much for getting back to me. I've tried the fast=FALSE, PC='direct' method and they are now running much, much quicker. Would you say if that's running quick enough now that I can ignore the option to manually set dt? I've plotted out all of the time intervals and can see that mostly the median is falling on the most common time interval (e.g. HD04_Sheep below), but not always (e.g. SB06_Mustata below). Is this still OK?Also, if I've previously run some with fast=TRUE, would you recommend re-running all of these again with the fast=FALSE, PC='direct' method, or are they all comparable still? I have compared some of the estimates from each method and they are almost identical, but just wanted to check.With regards to the duty cycling of the tags recording less frequently when the animal is stationary compared to moving, is this going to be a problem? Are there ways to deal with this sort of data? I am using commercially-available pet trackers, so I don't have much control over the fix interval or the data I can download. I was hoping that upweighting the fixes with greater temporal spacing would reflect that the animal is spending longer in that area because they are stationary.This also links to the issue I have with the error in that I don't get any measure of the error for each fix in the data I can download. I did, however, ask the company to provide me with an average error over the tracking time, which is usually around 50m, but I don't have anything more detailed than that so I'm not sure how useful this would be if I'm just applying the same error to each point?Thanks again, I really appreciate your help!Beth

--
You received this message because you are subscribed to a topic in the Google Groups "ctmm R user group" group.
To unsubscribe from this topic, visit https://groups.google.com/d/topic/ctmm-user/zdD_CgWWRLE/unsubscribe.
To unsubscribe from this group and all its topics, send an email to ctmm-user+...@googlegroups.com.
To view this discussion on the web visit https://groups.google.com/d/msgid/ctmm-user/1907d339-205b-47f8-ae29-ff1ed9b30c46n%40googlegroups.com.
Bethany Smith
May 13, 2022, 3:33:06 PM5/13/22
to Christen Fleming, ctmm R user group
Hi Chris,
OK brilliant, I'll try that. Thank you so much!
Beth
Bethany Smith
May 13, 2022, 3:33:13 PM5/13/22
to Christen Fleming, ctmm R user group
Christen Fleming
May 13, 2022, 3:33:17 PM5/13/22
to Bethany Smith, ctmm R user group
Hi Bethany,
fast=TRUE is an approximation of fast=FALSE, so if fast=FALSE is working well, then I would stick with that. fast=FALSE does not require or use the dt argument.
If you were to run with fast=TRUE, then you would want to identify and use that ~2:30 sampling interval.
If you've already run a bunch with fast=TRUE, then it would have probably been good as long as automated dt came out to be a divisor of that ~2:30 sampling interval. The default setting isn't the median.
The weights would probably help with the density estimation for that kind of data, but the speed estimates will only correspond to the active time periods.
You could consider collecting some calibration data in a representable environment(s) and using that to fix the errors. You just need something reasonable to take care of those few sub-minute data points.
Best,
Chris
On Fri, May 13, 2022 at 11:38 AM Bethany Smith <betha...@gmail.com> wrote:
Hi Christen,Thanks so much for getting back to me. I've tried the fast=FALSE, PC='direct' method and they are now running much, much quicker. Would you say if that's running quick enough now that I can ignore the option to manually set dt? I've plotted out all of the time intervals and can see that mostly the median is falling on the most common time interval (e.g. HD04_Sheep below), but not always (e.g. SB06_Mustata below). Is this still OK?Also, if I've previously run some with fast=TRUE, would you recommend re-running all of these again with the fast=FALSE, PC='direct' method, or are they all comparable still? I have compared some of the estimates from each method and they are almost identical, but just wanted to check.With regards to the duty cycling of the tags recording less frequently when the animal is stationary compared to moving, is this going to be a problem? Are there ways to deal with this sort of data? I am using commercially-available pet trackers, so I don't have much control over the fix interval or the data I can download. I was hoping that upweighting the fixes with greater temporal spacing would reflect that the animal is spending longer in that area because they are stationary.This also links to the issue I have with the error in that I don't get any measure of the error for each fix in the data I can download. I did, however, ask the company to provide me with an average error over the tracking time, which is usually around 50m, but I don't have anything more detailed than that so I'm not sure how useful this would be if I'm just applying the same error to each point?Thanks again, I really appreciate your help!Beth


On Thu, May 12, 2022 at 6:33 PM Christen Fleming <chris.h...@gmail.com> wrote:
Bethany Smith
May 13, 2022, 3:33:22 PM5/13/22
to Christen Fleming, ctmm R user group
Hi Christen,

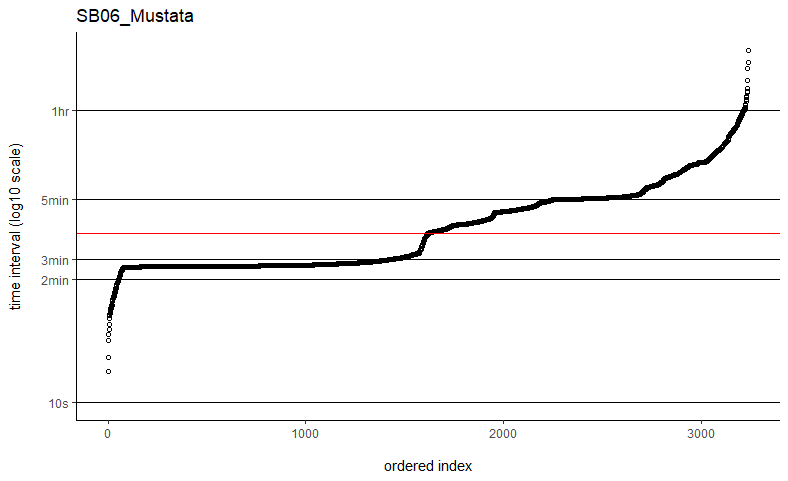
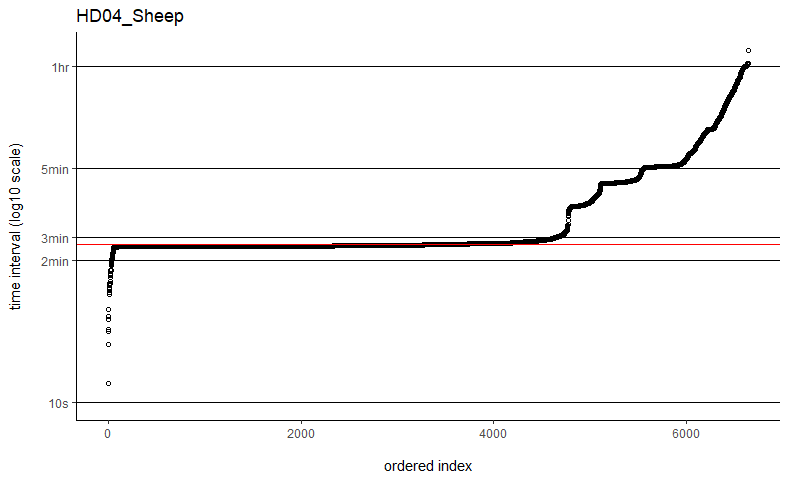
Thanks so much for getting back to me. I've tried the fast=FALSE, PC='direct' method and they are now running much, much quicker. Would you say if that's running quick enough now that I can ignore the option to manually set dt? I've plotted out all of the time intervals and can see that mostly the median is falling on the most common time interval (e.g. HD04_Sheep below), but not always (e.g. SB06_Mustata below). Is this still OK?
Also, if I've previously run some with fast=TRUE, would you recommend re-running all of these again with the fast=FALSE, PC='direct' method, or are they all comparable still? I have compared some of the estimates from each method and they are almost identical, but just wanted to check.
With regards to the duty cycling of the tags recording less frequently when the animal is stationary compared to moving, is this going to be a problem? Are there ways to deal with this sort of data? I am using commercially-available pet trackers, so I don't have much control over the fix interval or the data I can download. I was hoping that upweighting the fixes with greater temporal spacing would reflect that the animal is spending longer in that area because they are stationary.
This also links to the issue I have with the error in that I don't get any measure of the error for each fix in the data I can download. I did, however, ask the company to provide me with an average error over the tracking time, which is usually around 50m, but I don't have anything more detailed than that so I'm not sure how useful this would be if I'm just applying the same error to each point?
Thanks again, I really appreciate your help!
Beth
On Thu, May 12, 2022 at 6:33 PM Christen Fleming <chris.h...@gmail.com> wrote:
Bethany Smith
May 16, 2022, 12:51:05 PM5/16/22
to ctmm R user group
Hi Chris,
Think I've got everything running with the error models now - thank you!
Just a quick question: is there a way to force the output units to square kilometres? I'm getting a mixture of square kilometres (for most outputs) and hectares (for the smaller home range estimates), but would be much easier just to see them all as square kilometres rather than adding an additional conversion.
Thanks!
Beth
Christen Fleming
May 16, 2022, 5:44:03 PM5/16/22
to ctmm R user group
Hi Beth,
units=FALSE outputs SI units (as they are stored internally), and then "km^2" %#% AREA will convert AREA from SI units to square kilometers.
Best,
Chris
Bethany Smith
Jul 19, 2022, 9:12:27 AM7/19/22
to ctmm R user group
Hi Chris,
A bit of delay on this one as I've been away doing fieldwork and just coming back to it now. I previously said I had everything running with the error models, which was true until I got to my last field site, which seems to run infinitely and I'm not sure why. If I were to send you the data and a minimal working example would you be able to take a quick look at this please? I'm sure it's probably something to do with the data structure but it's getting beyond my trouble-shooting abilities.
Best wishes,
Beth
Christen Fleming
Jul 19, 2022, 3:02:52 PM7/19/22
to ctmm R user group
Sure thing.
Best,
Chris
Reply all
Reply to author
Forward
0 new messages