Determining Chi square
16 views
Skip to first unread message

Jikson P Mathew
Oct 21, 2022, 8:19:18 AM10/21/22
to COPASI User Forum
Hi All,
I like to determine the goodness of the fit in COPASI. How can I do that?
I work with parameter estimation. Here in the Results section:
under the Main tab, we have Objective Value and Root Mean Square?
What do these values correspond to?
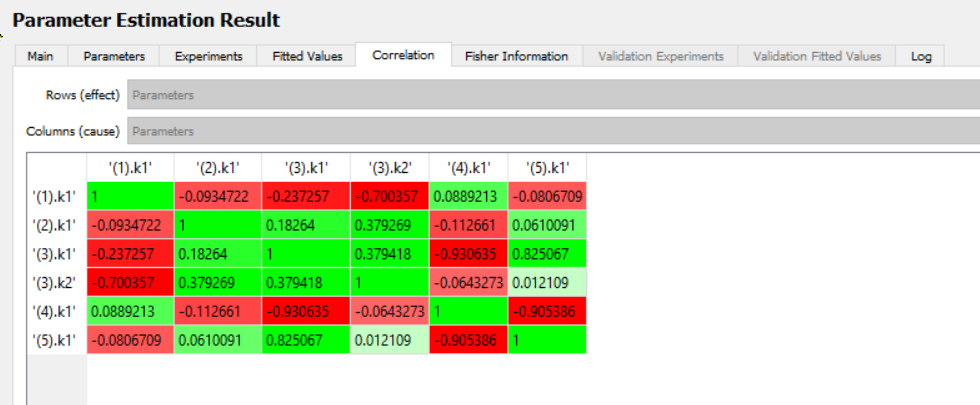
Also, what can we infer from the correlation table? (see the attached figure for reference)
Thank you in advance.
Kind regards,
Jikson

Pedro Mendes
Oct 23, 2022, 11:56:41 AM10/23/22
to copasi-u...@googlegroups.com
Hello Jikson,
The "Objective Value" is the weighted sum of square of residuals.
RMS is the square root of the sum of square of residuals divided by the
number of data points.
Both of these are indicators of the goodness of fit.
The correlation matrix of the estimated parameters tells you which ones
seem to be more dependent on each other. In your case you have a pretty
decent picture. Only the parameters of reaction 3 and 4 seem to have
some dependency (0.93 is not too bad, though). This is a kind of
linearized estimate of identifiability between parameters, but there are
better methdos to study that (eg see
https://doi.org/10.1016/j.biosystems.2012.09.003 , but that takes a a
lot more time to do)
Pedro
> --
> You received this message because you are subscribed to the Google
> Groups "COPASI User Forum" group.
> To unsubscribe from this group and stop receiving emails from it, send
> an email to copasi-user-fo...@googlegroups.com
> <mailto:copasi-user-fo...@googlegroups.com>.
> To view this discussion on the web visit
> https://groups.google.com/d/msgid/copasi-user-forum/18c7e88d-6aa9-4a4e-802a-3508d127058cn%40googlegroups.com <https://groups.google.com/d/msgid/copasi-user-forum/18c7e88d-6aa9-4a4e-802a-3508d127058cn%40googlegroups.com?utm_medium=email&utm_source=footer>.
--
Pedro Mendes, PhD
Professor and Director,
Richard D. Berlin Center for Cell Analysis and Modeling
University of Connecticut School of Medicine
group website: http://www.comp-sys-bio.org
The "Objective Value" is the weighted sum of square of residuals.
RMS is the square root of the sum of square of residuals divided by the
number of data points.
Both of these are indicators of the goodness of fit.
The correlation matrix of the estimated parameters tells you which ones
seem to be more dependent on each other. In your case you have a pretty
decent picture. Only the parameters of reaction 3 and 4 seem to have
some dependency (0.93 is not too bad, though). This is a kind of
linearized estimate of identifiability between parameters, but there are
better methdos to study that (eg see
https://doi.org/10.1016/j.biosystems.2012.09.003 , but that takes a a
lot more time to do)
Pedro
> You received this message because you are subscribed to the Google
> Groups "COPASI User Forum" group.
> To unsubscribe from this group and stop receiving emails from it, send
> an email to copasi-user-fo...@googlegroups.com
> <mailto:copasi-user-fo...@googlegroups.com>.
> To view this discussion on the web visit
> https://groups.google.com/d/msgid/copasi-user-forum/18c7e88d-6aa9-4a4e-802a-3508d127058cn%40googlegroups.com <https://groups.google.com/d/msgid/copasi-user-forum/18c7e88d-6aa9-4a4e-802a-3508d127058cn%40googlegroups.com?utm_medium=email&utm_source=footer>.
--
Pedro Mendes, PhD
Professor and Director,
Richard D. Berlin Center for Cell Analysis and Modeling
University of Connecticut School of Medicine
group website: http://www.comp-sys-bio.org
Jikson P Mathew
Oct 24, 2022, 8:14:00 AM10/24/22
to copasi-u...@googlegroups.com
Dear Prof. Pedro,
Many thanks for the reply.
For the correlation table, Can I take it like the "Green" color means that there is a good relationship between the two parameters, while a "Red" means the dependence/relationship is not strong?
Thanks and regards,
Jikson
To unsubscribe from this group and stop receiving emails from it, send an email to copasi-user-fo...@googlegroups.com.
To view this discussion on the web visit https://groups.google.com/d/msgid/copasi-user-forum/9002f67b-6ee7-50e0-2afa-535f556e8418%40uchc.edu.
Pedro Mendes
Oct 24, 2022, 9:08:07 AM10/24/22
to copasi-u...@googlegroups.com
Jikson,
The color coding is green for positive values, red for negative. The
color gets closer to white when closer to zero (from either side).
However in this table you need to avoid having very strong values
(positive or negative). ideally all numbers would be smaller than 0.9,
except the diagonal (of course). But in reality, in any model there will
always be values larger than 0.9, hopefully not too many. In your case
there is only one that I pointed out. (note that a correlation matrix
is symmetric, so I am only looking at the lower diagonal, the upper
diagonal is a mirror image)
Pedro
> <mailto:copasi-user-forum%2Bunsu...@googlegroups.com>
> > <mailto:copasi-user-fo...@googlegroups.com
> <mailto:copasi-user-forum%2Bunsu...@googlegroups.com>>.
The color coding is green for positive values, red for negative. The
color gets closer to white when closer to zero (from either side).
However in this table you need to avoid having very strong values
(positive or negative). ideally all numbers would be smaller than 0.9,
except the diagonal (of course). But in reality, in any model there will
always be values larger than 0.9, hopefully not too many. In your case
there is only one that I pointed out. (note that a correlation matrix
is symmetric, so I am only looking at the lower diagonal, the upper
diagonal is a mirror image)
Pedro
> > <mailto:copasi-user-fo...@googlegroups.com
> <mailto:copasi-user-forum%2Bunsu...@googlegroups.com>>.
> > To view this discussion on the web visit
> >
> https://groups.google.com/d/msgid/copasi-user-forum/18c7e88d-6aa9-4a4e-802a-3508d127058cn%40googlegroups.com <https://groups.google.com/d/msgid/copasi-user-forum/18c7e88d-6aa9-4a4e-802a-3508d127058cn%40googlegroups.com> <https://groups.google.com/d/msgid/copasi-user-forum/18c7e88d-6aa9-4a4e-802a-3508d127058cn%40googlegroups.com?utm_medium=email&utm_source=footer <https://groups.google.com/d/msgid/copasi-user-forum/18c7e88d-6aa9-4a4e-802a-3508d127058cn%40googlegroups.com?utm_medium=email&utm_source=footer>>.
> >
>
> --
> Pedro Mendes, PhD
> Professor and Director,
> Richard D. Berlin Center for Cell Analysis and Modeling
> University of Connecticut School of Medicine
> group website: http://www.comp-sys-bio.org <http://www.comp-sys-bio.org>
> --
> Pedro Mendes, PhD
> Professor and Director,
> Richard D. Berlin Center for Cell Analysis and Modeling
> University of Connecticut School of Medicine
>
> --
> You received this message because you are subscribed to the Google
> Groups "COPASI User Forum" group.
> To unsubscribe from this group and stop receiving emails from it,
> send an email to copasi-user-fo...@googlegroups.com
> <mailto:copasi-user-forum%2Bunsu...@googlegroups.com>.
> --
> You received this message because you are subscribed to the Google
> Groups "COPASI User Forum" group.
> To unsubscribe from this group and stop receiving emails from it,
> send an email to copasi-user-fo...@googlegroups.com
> To view this discussion on the web visit
> https://groups.google.com/d/msgid/copasi-user-forum/9002f67b-6ee7-50e0-2afa-535f556e8418%40uchc.edu <https://groups.google.com/d/msgid/copasi-user-forum/9002f67b-6ee7-50e0-2afa-535f556e8418%40uchc.edu>.
>
> --
> You received this message because you are subscribed to the Google
> Groups "COPASI User Forum" group.
> To unsubscribe from this group and stop receiving emails from it, send
> an email to copasi-user-fo...@googlegroups.com
> <mailto:copasi-user-fo...@googlegroups.com>.
> To view this discussion on the web visit
> https://groups.google.com/d/msgid/copasi-user-forum/CAC%2B%2Bh6e55PGFmELYKaxtKN6rmarFhUpSfx4cjRfyjEUTx3D2Gg%40mail.gmail.com <https://groups.google.com/d/msgid/copasi-user-forum/CAC%2B%2Bh6e55PGFmELYKaxtKN6rmarFhUpSfx4cjRfyjEUTx3D2Gg%40mail.gmail.com?utm_medium=email&utm_source=footer>.
> --
> You received this message because you are subscribed to the Google
> Groups "COPASI User Forum" group.
> To unsubscribe from this group and stop receiving emails from it, send
> an email to copasi-user-fo...@googlegroups.com
> <mailto:copasi-user-fo...@googlegroups.com>.
> To view this discussion on the web visit

Sluka, James Patrick
Oct 24, 2022, 2:22:33 PM10/24/22
to copasi-u...@googlegroups.com
Since these are correlations, you want numbers near zero. Near +1 means they are positively correlated and -1 means they are negatively correlated. “Negative correlation” (=-1) means a perfect line of correlation but with a negative slope.
To view this discussion on the web visit https://groups.google.com/d/msgid/copasi-user-forum/CAC%2B%2Bh6e55PGFmELYKaxtKN6rmarFhUpSfx4cjRfyjEUTx3D2Gg%40mail.gmail.com.
Reply all
Reply to author
Forward
0 new messages