outputs question of volume
33 views
Skip to first unread message

小明
May 27, 2021, 12:34:01 AM5/27/21
to cmtk-users
Hi,
I'm a little confused about the resulting file.
output/../anat/sub-***_atlas-L2018_res-scale1_stats.tsv
I think that's right.
But, In the file below
output/../dwi/sub-***_atlas-L2018_res-scale1_conndata-network_connectivity.mat
nodes.roi_volume
What is this value, please, I don't find answer in connectome-mapper-3.readthedocs,
Please, thnks a lot
wei

Sebastien Tourbier
May 27, 2021, 6:37:13 AM5/27/21
to cmtk-users
Hi Wei,
In the .mat files, the nodes structure contains all information related to the node graph i.e. region of interest (ROI) and the roi_volume is the volume of each ROI in voxels as opposed of the volume reported in mm3 in the sub-***_atlas-L2018_res-scale1_stats.tsv.
Here is the part of code implicated in the computation of this value:
Hope this helps!
Best,
Sebastien
小明
May 28, 2021, 5:59:46 AM5/28/21
to cmtk-...@googlegroups.com
Hi
Sebastien,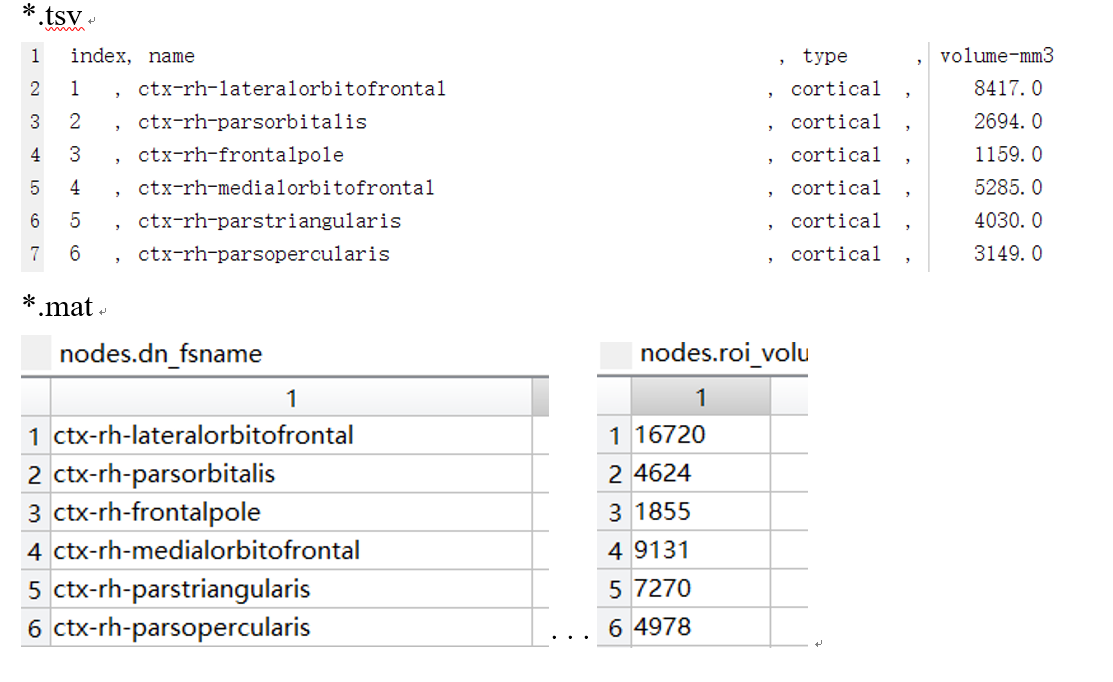
Thanks for you reply!
I would have thought so, but the value in ***.tsv and nodes.roi_volume is different.
For example, below
Here is another problem that needs your help, We know the lausannne2018 mask have 68,114,219,448,1000 nodes in 5 scales,
we can also get this information from .../connectomicslab-connectomemapper3-34cfaf0/cmtklib/data/parcellation/lausanne2018/lausanne2018.scale{1,2,3,4,5}_FreeSurferColorLUT.txt
When I use Connectome Mapper 3, and Anatomical pipeline stages chose Lausanne2018, I got nodes number in 5 scales are 68,114,216,446,1002, I checked the files and found that the discrepancy came from the left hemisphere.
When I use Connectome Mapper 3, and Anatomical pipeline stages chose Lausanne2018, I got nodes number in 5 scales are 68,114,216,446,1002, I checked the files and found that the discrepancy came from the left hemisphere.
But there will be no difference in the number of nodes in Lausanne2008, I did the same thing.
Sebastien Tourbier <sebastien...@gmail.com> 于2021年5月27日周四 下午6:37写道:
--
You received this message because you are subscribed to a topic in the Google Groups "cmtk-users" group.
To unsubscribe from this topic, visit https://groups.google.com/d/topic/cmtk-users/y1GEQEnl8jw/unsubscribe.
To unsubscribe from this group and all its topics, send an email to cmtk-users+...@googlegroups.com.
To view this discussion on the web visit https://groups.google.com/d/msgid/cmtk-users/6cb026bd-986b-4ad7-ae64-211b413e7da3n%40googlegroups.com.
祝好!
盛巍
小明
Jun 2, 2021, 10:40:37 PM6/2/21
to cmtk-users
Hi Sebastien,
I'm sorry to to bother you again.
I repeated, and I could not get the same number of nodes at 5 different scales except scale1.
Sebastien Tourbier
Jun 7, 2021, 3:51:48 AM6/7/21
to cmtk-users
Hi Wei,
Sorry I had to leave for family reasons and I am just back to work.
The two roi volumes are indeed expected to be different.
The
roi volume in the _stats.tsv file corresponds to the volume of the ROI
is the space of the anatomical (resampled) T1w and is reported in mm3.
The roi volume in the connectome file corresponds to the number of
voxels composing the ROI projected in the space of the resampled DWI,
applying the transforms estimated by the T1w<->DWI b0 registration
stage. Therefore, the only case where I see they could be the same is
only if the voxel size is 1mm3 isotropic and the transform is identity.
Note that the fiber density metric used the later.
Regarding
"
Here is another problem that needs your help, We know the lausannne2018 mask have 68,114,219,448,1000 nodes in 5 scales,
we can also get this information from .../connectomicslab-connectomemapper3-34cfaf0/cmtklib/data/parcellation/lausanne2018/lausanne2018.scale{1,2,3,4,5}_FreeSurferColorLUT.txt
When I use Connectome Mapper 3, and Anatomical pipeline stages chose Lausanne2018, I got nodes number in 5 scales are 68,114,216,446,1002, I checked the files and found that the discrepancy came from the left hemisphere.
When I use Connectome Mapper 3, and Anatomical pipeline stages chose Lausanne2018, I got nodes number in 5 scales are 68,114,216,446,1002, I checked the files and found that the discrepancy came from the left hemisphere.
But there will be no difference in the number of nodes in Lausanne2008, I did the same thing.
"
Lausanne2008 and Lausanne2018 schemes differ in the way the volumetric parcellations and the associated .graphml/FreeSurferColorLUT are generated. While Lausanne2008 was using custom .gcs files to generate them ROI-by-ROI, Lausanne2018 is using an alternative and most optimal/efficient way with .annot files to generate them in one shot, but it also was corrected to be symmetric. Lausanne2008 was indeed having some issues with not being totally symmetric, by not having the same number of ROI per hemisphere in some scales. Here is a little description coming from a colleague on how he generated Lausanne2018:
1. The right hemisphere labels were projected in the left
hemisphere to create a symmetric version of the multiscale cortical
parcellation proposed by Cammoun.
2. For scale 1, the
boundaries of the projected regions over the left hemisphere were
matched to the boundaries of the original parcellation for the left
hemisphere.
3. This transformation was applied for the rest of the scales.
Hope this helps,
Seb
小明
Jun 7, 2021, 4:43:37 AM6/7/21
to cmtk-...@googlegroups.com
Hi Sebastien,
Thank you for your detailed answers, help me understand a lot of the details of, and I'm sorry to bother you so many times.
Best,
Wei
Sebastien Tourbier <sebastien...@gmail.com> 于2021年6月7日周一 下午3:51写道:
--
You received this message because you are subscribed to the Google Groups "cmtk-users" group.
To unsubscribe from this group and stop receiving emails from it, send an email to cmtk-users+...@googlegroups.com.
To view this discussion on the web visit https://groups.google.com/d/msgid/cmtk-users/fc7883eb-e478-42b7-a692-a6a0d8334eaen%40googlegroups.com.
祝好!
盛巍
Sebastien Tourbier
Jun 7, 2021, 6:25:33 AM6/7/21
to cmtk-users
Hi,
This corresponds to the number of voxels of each ROI after applying the transformation from T1w to the DWI space. If you want the volume of each ROI you should rely on the output/../anat/sub-***_atlas-L2018_res-scale1_stats.tsv
Hope this is more clear,
Seb
On Thursday, May 27, 2021 at 6:34:01 AM UTC+2 acca...@gmail.com wrote:
Reply all
Reply to author
Forward
0 new messages