Decovolve components from SAXS batch experiments
23 views
Skip to first unread message

Alina Kulakova
May 25, 2021, 9:38:16 AM5/25/21
to BioXTAS RAW
Good afternoon Bioxtas RAW developers
I was wondering if it is possible to deconvolve SAXS scattering profile from the batch experiments.
I have a following system: my protein is present as a monomer and larger oligomer/oligomers. I tried to do SEC-SAXS to separate those species, but when the protein is diluted in the column, equilibrium shifts towards the monomer and I have only one elution peak. I have collected SAXS data for the concentration series and can see changes in the scattering with increasing protein concentration.
I have looked into REGALS, since it can be used for titration experiments, and was wandering if it can be used for the concentration series data.
Best regards,
Alina

Jesse Hopkins
May 25, 2021, 10:18:30 AM5/25/21
to bioxt...@googlegroups.com
Hi Alina,
In theory, REGALS should work to deconvolve scattering profiles from a concentration series. It would be a very similar approach to how it can be used for a titration series, as you note. In practice, I suspect your success will be determined by several factors, including the data quality, the relative concentrations of the components, how many data points in the concentration series you have, and if you have any other prior information (such as Dmax values) that you can use as constraints.
I'd certainly recommend giving it a try and seeing how it goes, but without looking at your data I can't say whether I think you're likely to get good results.
All the best.
- Jesse
----
Jesse Hopkins, PhD
Beamline Scientist
BioCAT, Sector 18
Advanced Photon Source
--
You received this message because you are subscribed to the Google Groups "BioXTAS RAW" group.
To unsubscribe from this group and stop receiving emails from it, send an email to bioxtas_raw...@googlegroups.com.
To view this discussion on the web visit https://groups.google.com/d/msgid/bioxtas_raw/6fdf390f-de46-4690-8a6b-e3126fadb20fn%40googlegroups.com.
Alina Kulakova
May 27, 2021, 9:49:22 AM5/27/21
to BioXTAS RAW
Dear Jesse,
Thank you for your answer.
I have tried to use REGALS for multiple concentration series, but it does not give me reasonable results. Therefore, I decided to try to run it on the data that I know more about:
I have a protein (around 75 kDa) which exist as a monomer, dimer, and trimer in solution. SEC-MALS data shows that at 1 g/L we have 85.4 % of monomer, 12.3 %dimer and around 2% of trimer. Since avaraged MW does not show significant changes with increasing concentration of the protein, we think that the ratio between the species does not change with concentration (meaning that when I deconvolve the data, I would expect to have constant concentrations for all the species).
I have tried to use REGALS to deconvolve scattering profiles, but it does not seem to work. p(r) function for one of the components does not look 'reasonable' and it estimates negative concentrations for two of the components. I have also tried to run it with only 2 components (since we only have 2% of trimer, it might be challenging to obtain the curve), but it still gives me negative concentration for one of the components.
More details about the data:
It is a concentration series of 1, 2, 5, 7, and 10 g/L.
Units: nm (I have coverted the data to Å and it seems to look better, but I still have a problem with negative concentrations).
Question: Is it possible that it fails to recognize multiple species, because we do not have any changes between the concentrations? I have also tried to run it with the data where I am confident that with increasing concentration the equilibrium shifts from monomer to the bigger species, but I did not manage to make it work either.
It can very well be that I am doing something wrong, but I cannot see what it is. I would very much appreatiate if you could look at the data and let me know where my mistake is.
Best regards,
Alina
Jesse Hopkins
May 27, 2021, 6:47:04 PM5/27/21
to bioxt...@googlegroups.com
Hi Alina,
I took a look at your dataset, and I don't think deconvolution with REGALS is going to be possible in this case. There are two main problems.
First, without the relative concentrations changing, you're going to have to fit all components to all ranges of the dataset, which will be hard. This means you'll have to distinguish the components based purely on Dmax. With the titration example, we had some prior knowledge about the range of the components which helped.
Second, it's not clear how many components there are in the dataset. You think you have monomer, dimer, and timer (though whether or not you can see the trimer is an interesting question). However, at least one of the profiles (2) shows some aggregation, while other profiles (3-5) show repulsion. So that adds an additional component or two to the dataset. This means that you're trying to deconvolve somewhere between 3-5 components from 5 profiles. That's not really enough data.
If you could retake the data without the aggregation or repulsion, maybe it would be possible, but even then I suspect we'd be pushing it.
Two other notes. First, I'm getting a MW that's firmly around 70-80 kDa for each profile, which would be the vast majority monomer, for every dataset. So is it possible that you just don't have any significant population of the oligomers in the first place?
Second, you say that when you did SEC-SAXS the dilution from the column caused there to only be one peak, which was monomer. Depending on the column and the loading, a typical dilution across a column would be from ~2-10x. Given the range of concentrations in your data (10 fold), the SEC-SAXS data would imply that you might expect a change in the distribution of the species in solution. The obvious case where that might not happen is if it was all (or a strong majority) in the monomeric form to start with.
Have you tried something like batch mode MALS with the concentrations you used for batch mode SAXS? You don't get the separation you do with SEC-MALS, but MALS MW (if your instrument is in good shape), should be significantly more accurate and precise than SAXS MW. You could use batch mode MALS to see if there is any change in MW as you change the concentration, which might help you figure out what's going on and target good conditions for your SAXS experiments. You'll know much better than I what's right for your system, but it's possible that some change in buffer conditions, addition of a ligand, etc, might induce the oligomeric structures you're looking for in higher quantities. Since you think they fall apart on a column, batch mode MALS would show the shift in MW and let you get an idea of what's going on.
Basically, I would like some way to verify that you actually have a distribution of oligomers in solution in SAXS before trying a deconvolution. Once you're convinced of that, you might be able to plan a SAXS experiment that yields a separable dataset.
All the best.
- Jesse
----
Jesse Hopkins, PhD
Beamline Scientist
BioCAT, Sector 18
Advanced Photon Source
To view this discussion on the web visit https://groups.google.com/d/msgid/bioxtas_raw/5b0da29f-bfd0-46d9-8676-76a219d46bcen%40googlegroups.com.

Kushol Gupta
May 28, 2021, 9:58:39 AM5/28/21
to bioxt...@googlegroups.com
A two-cent suggestion – a sedimentation velocity analytical ultracentrifugation (SV-AUC) experiment at different concentrations could be very useful in defining these species and getting a pulse on the Kds of association.
Kushol
Kushol Gupta, Ph.D.
Research Assistant Professor, Department of Biochemistry and Biophysics
Director, Johnson Foundation Structural Biology and Biophysics Core
Perelman School of Medicine at The University of Pennsylvania
kgu...@upenn.edu / 267.259.0082 / www.stwing.upenn.edu/~kgupta
To view this discussion on the web visit https://groups.google.com/d/msgid/bioxtas_raw/CAGRN2W2OcYDuR87N%2BCjHBNz16AbjWB%3DRk19hyeAvd9hK3Eaz_Q%40mail.gmail.com.
Alina Kulakova
May 31, 2021, 4:46:35 AM5/31/21
to BioXTAS RAW
Dear Jesse and Kushol,
Thank you very much for your suggestions. I did not have tried to do SV-AUC, but I did perform MALS in batch mode. It was not very successful, since calculated MW was way too high (I assume my protein formed aggregates, since I had to do transport the protein to perform the measurements in the different lab). I might try it again in the near future.
I have performed SEC-MALS experiments at different protein concentrations. I only see one peak, but I do see an increase in the avaraged MW with increasing protein concentration, which I think is an indication of the formation of bigger species. I think, the separation might have failed for 2 reasons: a) protein seems to interact with the column; b) while diluted by the column, it becomes more monomeric.
With my SAXS data collected in the batch mode, I can clearly see changes in the curve shape. But the problem is that I also have also quite high repulsion (see attached data), and I am not sure if it is why my decovolution fails. What do you think?
I have some more questions regarding the deconvolution of the concentration series:
1. How much of the data I can actually cut in order to remove repulsion, but still have enough information for the deconvolution?
2. If my protein is present as monomer + oligomer and its equilibrium actually changes with concentration, is it actually possible to deconvolve the data without having any other information about the oligomer? (for example if it is trimer or hexamer, if the oligomer is present at lowest concentration or not).
3. When I analyze concentration series using titration method, does it affect my data analysis if the file with the concentrations comes in mM or mg/mL?
4. For the future experiments: would it be beneficial to perform batch experiments at lower concentrations to avoid repulsion, but have a bit more noisy data?
I am sorry for bombarding you with so many questions. Its just because I would very much like to understand the program better and use it correctly for my data analysis.
Best regards,
Alina

Richard Gillilan
May 31, 2021, 8:47:06 AM5/31/21
to bioxt...@googlegroups.com
Took a quick look at your data. Here are a couple observations.
Looks like you are working in inverse nanometers rather than inverse angstroms. Most of us have worked in inverse angstroms over the years. RAW has the ability to convert (other operations -> convert q-scale), but there is a remote chance that
some part of the software, especially the newer parts like REGALS, might get confused if sent data in nanometers.
I think you have a small amount of large aggregates, based on how the Guinier plots look. The upturn is not a gradual "smile", but rather a sudden upturn at very small angle. This is often a sign of large particles, dust or precipitate, that *might*
be removed by aggressive centrifugation rather than higher oligomers. I've cut off the first 25 points to get a reasonable Guinier plot. You will probably need to do that for any analysis you do ... it's not ideal, but there isn't much choice unless you re-collect
the data with a cleaner sample.
You definitely have inter particle repulsion type of concentration effect that starts showing up at 10 mg/m and higher.
Do you have salt in the buffer? Some salt (maybe 150 mM) can help reduce this type of concentration effect and can also help your protein not stick to the
SEC column. Also what is the pH?
The problem with interparticle repulsion is that it will obscure your attempts to detect changes in oligomeric state with concentration.
My molecular weight estimates based on Vp and Vc give something more like 20-24 kDa much lower than your expected 75 kDa unless you meant 75 as the trimer. These methods are not as good with small or non-globular proteins, so maybe that is the
situation here.
I don't see clear evidence of higher oligomers just looking at the curves, even when aggressively chopping low-q values for Guinier analysis. The Vp Mol Wr estimate stays constant with increasing concentration while the Vp Mol Wt estimate falls.
Richard
To view this discussion on the web visit https://groups.google.com/d/msgid/bioxtas_raw/803af2a5-2a47-41ed-82f7-8d8a17dc5405n%40googlegroups.com.
<NT_C.zip>
Richard Gillilan
May 31, 2021, 9:26:44 AM5/31/21
to bioxt...@googlegroups.com
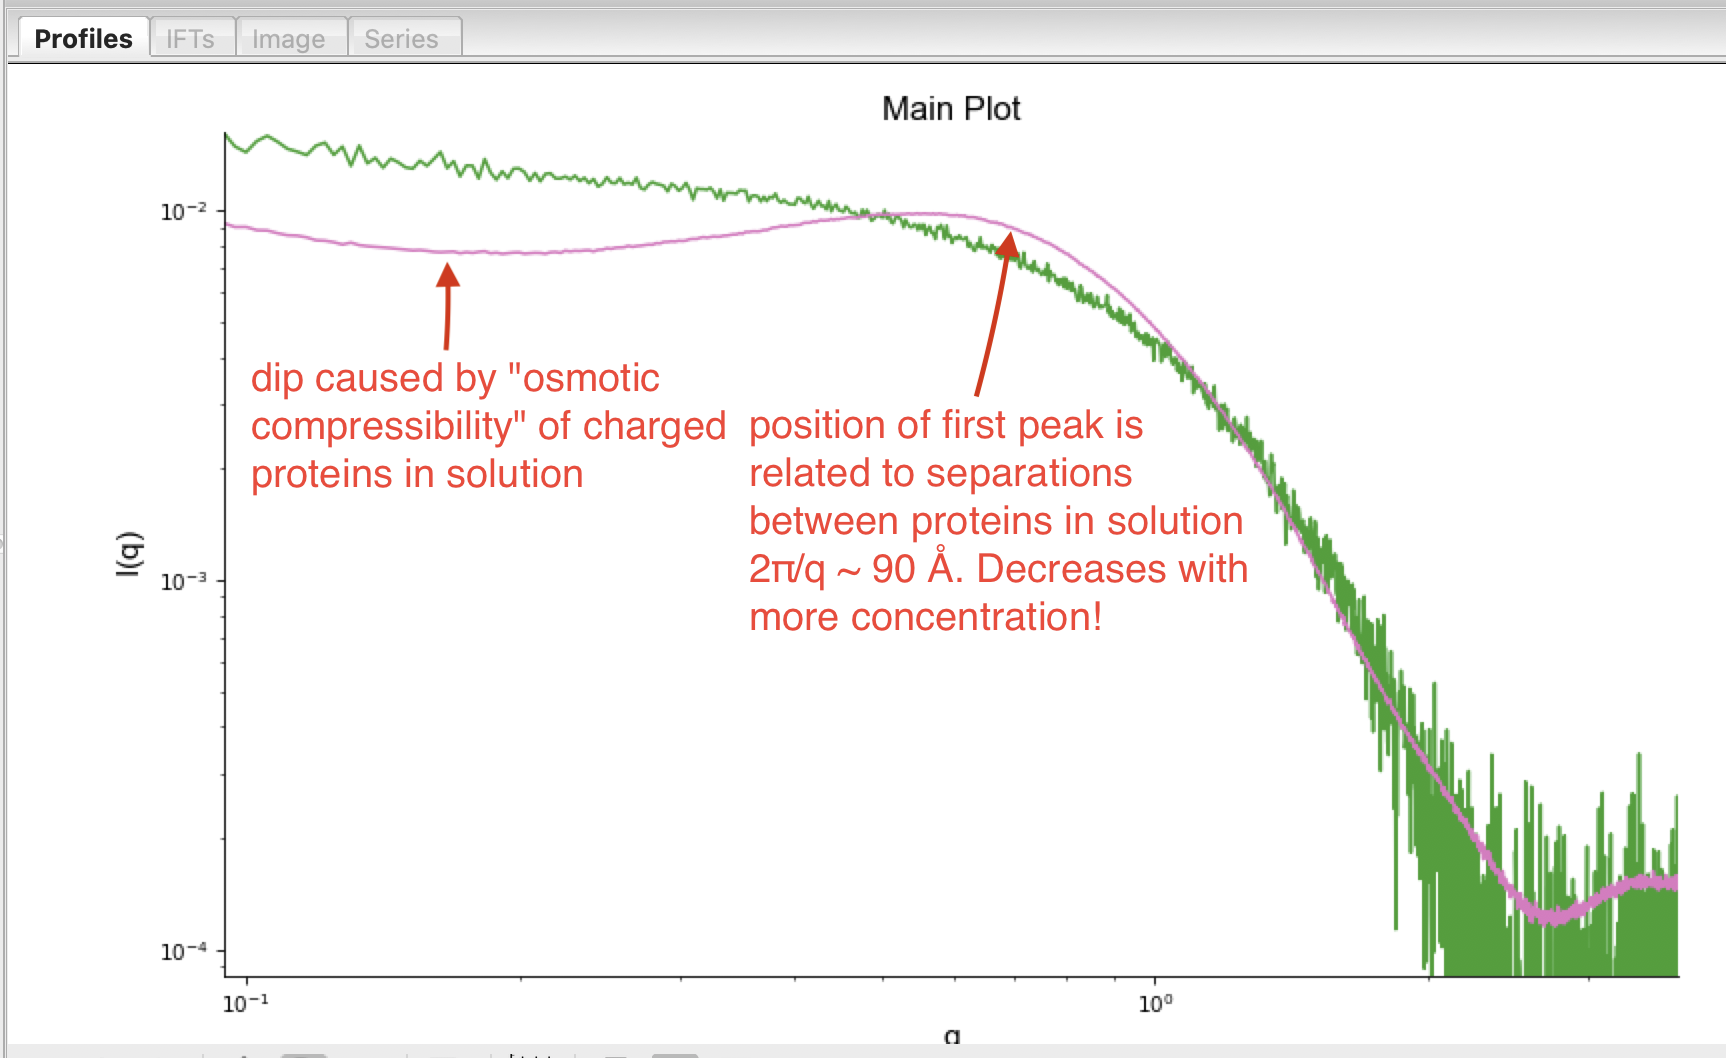
I just happen to be studying concentration effects right now (non-constant structure factors). Your data sure look like a classic case of monomer with charge repulsion. I have superimposed most dilute curve on most concentrated curve. Neglecting the small upturn
at lowest angle, there is always a big dip at lower angles which gets bigger with concentration. Ignoring the solvent, you can think of the proteins as if they were ideal gas atoms. The dip below the dilute scattering curve is related to the compressibility
of the "protein gas" which gets harder to compress as the particles get closer together. The first peak above the dilute curve is due to the separation between proteins in solution. This moves to lower angle as you get more concentrated. Sorry that none of
this probably helps your situation, but it may be helpful for you to see what is due to concentration effect: the concentrated curve rises above the dilute curve around q = 0.7 nm-1, but this is probably not evidence of increasing oligomers, but rather a natural
effect of interparticle interference.
Jesse Hopkins
May 31, 2021, 10:24:04 AM5/31/21
to bioxt...@googlegroups.com
Hi Alina,
As I previously said, I think there are three main issues with the data, as far as deconvolution goes:
1) There's significant signs of aggregation. As Richard mentions, it may be just some very large particles present in solution, so it might be okay to just cut off the lowest q datapoints. However, I would recommend recollecting the data
2) There's significant repulsion. I would say you start seeing repulsion around your C2 dataset. It's not clear to me that you can deconvolve that scattering, but if you can it will represent another component in solution and make the deconvolution more challenging.
3) It's not clear to me that you're seeing any higher order oligomers in these samples. There's not changes in the profile that I can definitely say come from more oligomer rather than the concentration effect (see Richard's email about this).
These problems are all potentially solvable:
1) Either centrifuge the sample for 10 minutes just before collection (always a good idea), or repurify the sample on site. I know you said that you can't do SEC-SAXS, but if you could run a size exclusion column, collect the fraction, and reconcentrate to the desired batch mode concentration. That should eliminate any of these large particles (assuming they're not being formed by the sample).
2) Change your buffer conditions to eliminate the repulsion. This usually involves adding more salt or changing the pH, or both.
3) Use another biophysical characterization method, such as MALS or AUC, to further characterize the oligomerization in the sample so that you know what to expect.
As far as your questions go:
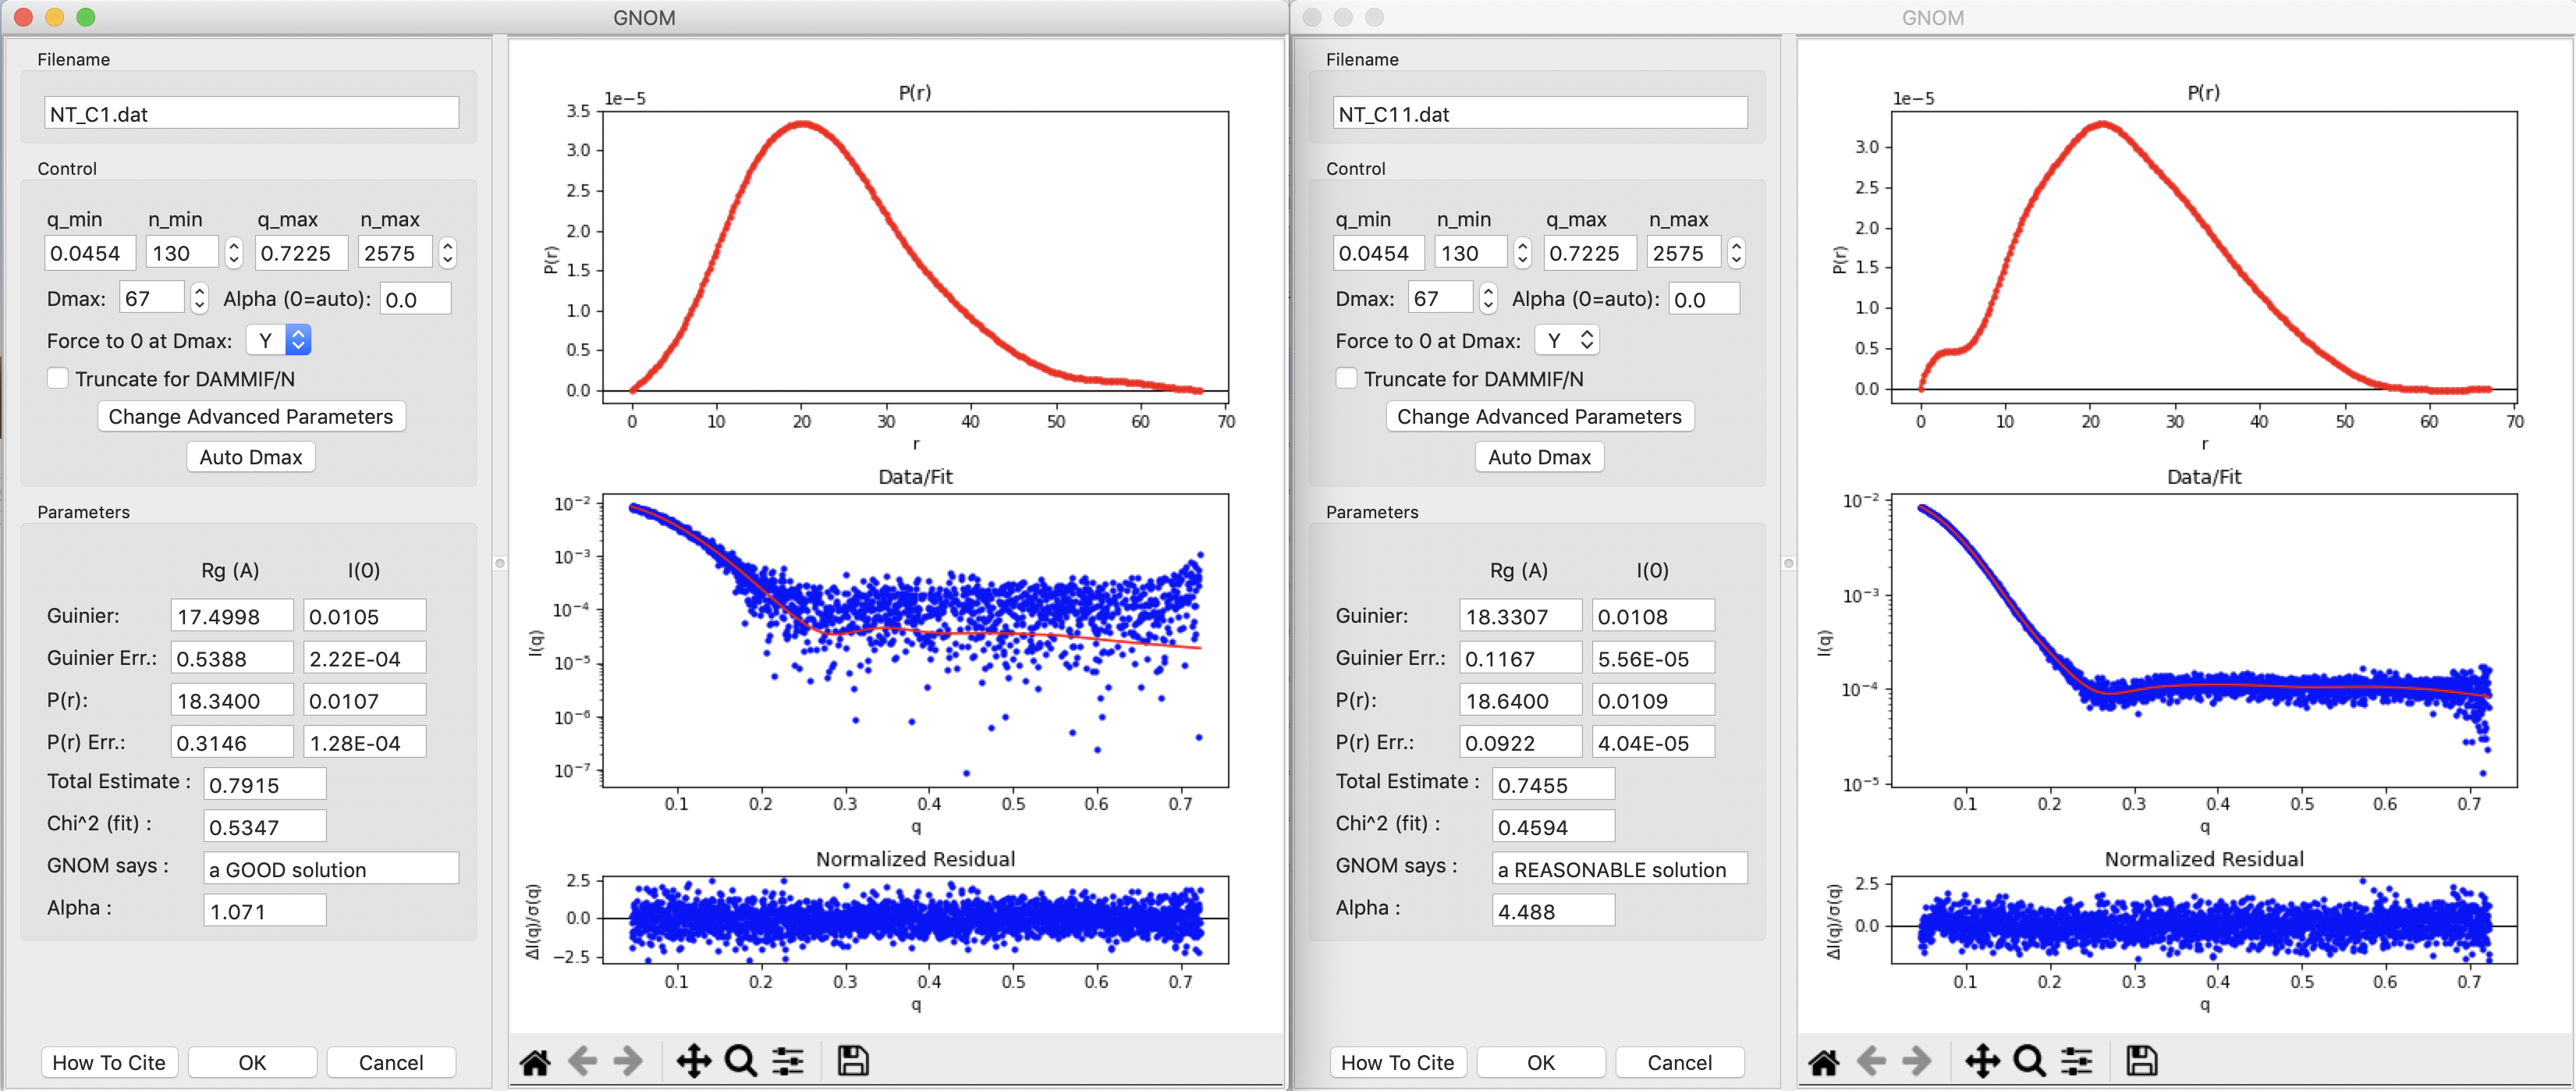
1) There's not a firm cutoff for what constitutes sufficient data for deconvolution. In theory, as long as you have measured to q < pi/Dmax it should work, like most SAXS analysis techniques. In practice, having some degree of oversampling is probably best. However, I don't think you can really remove repulsion from your dataset. Though it will have the largest contribution at low q, it can affect the profile further out than the Guinier range, which will corrupt downstream analysis.
I've attached a screenshot where I show the C11 dataset (significant repulsion) that I've truncated to 0.045 (first 130 points), which cuts off the repulsion. I've done the same thing to the C1 dataset, which shows little to no repulsion. You can see that even with the truncated Guinier range the C11 dataset shows a smaller Dmax, and possibly a dip below 0 when extended to the same Dmax as the C1 dataset, all of which is very characteristic of repulsion. This shows that we haven't removed the truncation effect. This is why above I recommend that you retake the data changing your solution conditions to remove the repulsive effect.
2) Yes. If you read the original REGALS paper (https://journals.iucr.org/m/issues/2021/02/00/mf5050/index.html) you'll see that they do something similar with time resolved data. However, you will need other biophysical characterization to back up whatever deconvolution you do. The SAXS data will not (or at least should not) stand on its own in this kind of situation.
3) No, because it's just an overall scale factor to convert between the two.
4) I think the issue is whether or not you have sufficient concentrations of an oligomer at the concentration you're measuring to see it with SAXS. I would work on refining the buffer conditions to allow measurement at your current conditions.
Finally, to address a point that Richard made, RAW is agnostic to A vs. nm. However, it is designed with A in mind, so a lot of the tools may have natural limitations that more suit that data. For example, the GNOM window doesn't allow fractional Dmax values. This is because the difference between 60 and 60.1 A (for example) is essentially meaningless for Dmax. However, if you're working in nm, you'd want to be able to adjust between 6 and 6.1, and you can't do that. So I would recommend working in 1/A when using RAW.
All the best.
- Jesse
----
Jesse Hopkins, PhD
Beamline Scientist
BioCAT, Sector 18
Advanced Photon Source
On Mon, May 31, 2021 at 8:26 AM Richard Gillilan <re...@cornell.edu> wrote:
I just happen to be studying concentration effects right now (non-constant structure factors). Your data sure look like a classic case of monomer with charge repulsion. I have superimposed most dilute curve on most concentrated curve. Neglecting the small upturn at lowest angle, there is always a big dip at lower angles which gets bigger with concentration. Ignoring the solvent, you can think of the proteins as if they were ideal gas atoms. The dip below the dilute scattering curve is related to the compressibility of the "protein gas" which gets harder to compress as the particles get closer together. The first peak above the dilute curve is due to the separation between proteins in solution. This moves to lower angle as you get more concentrated. Sorry that none of this probably helps your situation, but it may be helpful for you to see what is due to concentration effect: the concentrated curve rises above the dilute curve around q = 0.7 nm-1, but this is probably not evidence of increasing oligomers, but rather a natural effect of interparticle interference.

--
You received this message because you are subscribed to the Google Groups "BioXTAS RAW" group.
To unsubscribe from this group and stop receiving emails from it, send an email to bioxtas_raw...@googlegroups.com.
To view this discussion on the web visit https://groups.google.com/d/msgid/bioxtas_raw/FD117294-4166-477C-AE30-F2A54BE50AB9%40cornell.edu.
Alina Kulakova
Jun 1, 2021, 4:26:49 AM6/1/21
to BioXTAS RAW
Dear all,
Thank you very much for your valuable input. I will definitely be careful in analyzing this data and will try to perform additional experiments.
Best regards,
Alina
Reply all
Reply to author
Forward
0 new messages