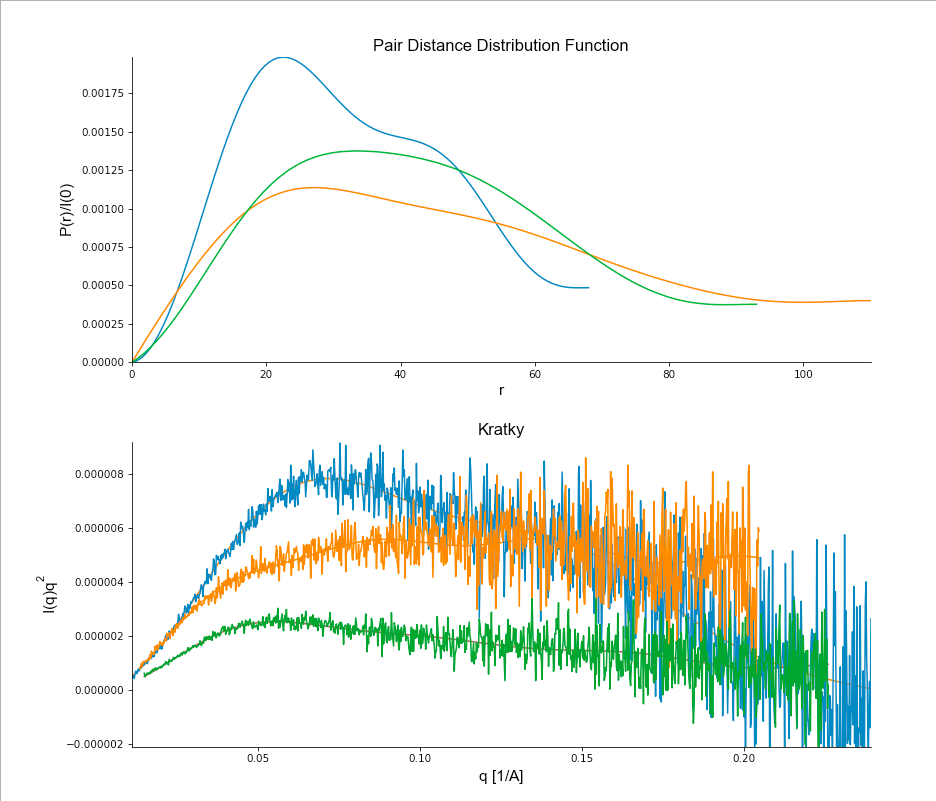
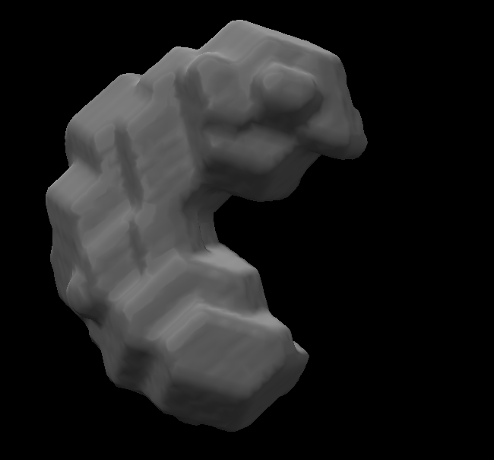
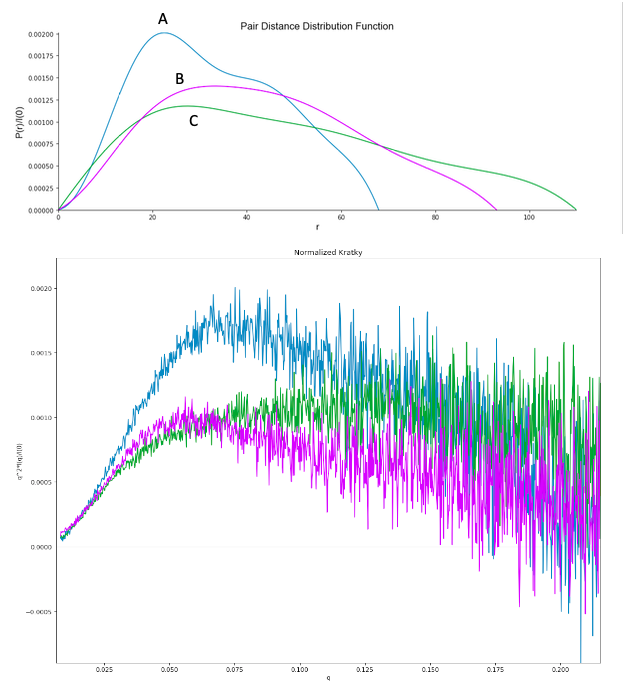
Evaluating Flexibility of 3 Different Proteins

16 views
Skip to first unread message

Sherik726

unread,
Jul 30, 2020, 11:24:59 AM7/30/20
to BioXTAS RAW
Hello,

My question is not directly related to RAW, but I wanted the opinion of the CHESS experts. Attached is an Indirect Fourier Transformation plot and Kratky plot of 3 different proteins. Important to note that these proteins are super stable, so no unfolding should be occurring. I have come to the conclusion that the blue is a less flexible protein. The orange and green proteins are more flexible. Would you agree?

Also, is there a way in RAW to get a value of flexibility as opposed to looking at the plot curves?

Cheers,
Mustafa
Screen Shot 2020-07-30 at 11.04.29 AM.png

Richard Gillilan

unread,
Jul 30, 2020, 11:34:32 AM7/30/20
to bioxt...@googlegroups.com
Hi Mustafa,

I suggest you use the “normalized Kratky plot” when comparing different proteins on the same scale. It looks like you have already normalized the P(r) functions by I(0), which is good.

It is troubling that your P(r) functions do not fall to zero at large r. This is an indication that something is wrong with your P(r) calculation or with the data. Perhaps Jesse will comment. 

Richard

--
You received this message because you are subscribed to the Google Groups "BioXTAS RAW" group.
To unsubscribe from this group and stop receiving emails from it, send an email to bioxtas_raw...@googlegroups.com.
To view this discussion on the web visit https://groups.google.com/d/msgid/bioxtas_raw/1561abf4-2411-4cd3-99dc-dcbda041db5eo%40googlegroups.com.
<Screen Shot 2020-07-30 at 11.04.29 AM.png>

Jesse Hopkins

unread,
Jul 30, 2020, 11:46:56 AM7/30/20
to bioxt...@googlegroups.com
Hi Mustafa,

Yes, use a dimensionless kratky plot. See this tutorial starting at 7:

Also, as Richard says, your P(r) functions should go to zero at Dmax. There are two issues here. First, you should have force to zero turned on (at least for your final P(r) function, it's okay to have it off for testing). Second, you should extend out your Dmax value so it falls to zero naturally. You might find this tutorial helpful:

At the moment I'm hesitant to comment on your curves, if you do the dimensionless Kratky plot and fix the P(r) functions I can probably provide some advice.

And no, there's no way to produce a single measure of flexibility for a SAXS curve (at least not that I know). The dimensionless Kratky plot is the closest you come, but you'll need to support that with other evidence, such as the shape of the P(r) function.

All the best.

- Jesse

----
Jesse Hopkins, PhD
Beamline Scientist
BioCAT, Sector 18
Advanced Photon Source


kushol...@gmail.com

unread,
Jul 30, 2020, 11:59:55 AM7/30/20
to bioxt...@googlegroups.com

Two cents –


Check out https://pubmed.ncbi.nlm.nih.gov/21509745/

I frequently will use the Porod exponent as quantified in the program ScAtter and the flexibility plots described to characterize this property.


Also check out the work of Pau Bernado’s group characterizing polyubiquitin chains using SAXS and EOMs. Some great discussions of how flexibility manifests itself in SAS data and analysis at every stage.


Also see if your masses determined by Vc and I(0) greatly vary with those sensitive to protein volume and compactness like Vp and from the bead models.  The latter calculations will be compromised by flexibility.


Kushol

Sherik726

unread,
Aug 2, 2020, 11:24:17 AM8/2/20
to BioXTAS RAW

Hello,

Thank you for all your responses. I have followed the tutorials from before and was unable to get the P(r) functions to smoothly fall to zero. It seems like my data is suffering from aggregation. Even with these problems, I am getting some good molecular envelopes. Attached below is a picture of the molecular envelope of Protein A (list of proteins is below). 

For the data set I have attached, I forced to zero and used a normalized Kratky plot. Important to note that two of the three proteins are not globular, they are rod-like. Below I have a description of each protein. They are labeled according to the curves on the plots.

Protein A: 2 domains connected by a single linker region. Rod-like in shape and a molecular weight of 40 kDa.
Protein B: 4 domains, rod-like (based on BioSAXS envelope, it is curling up into a globular-like protein), 60 kDa
Protein C: 2 domains connected by a single linker region. Rod-like and molecular weight of 35 kDa. 

I just wanted to give a little bit of more context to help you with commenting on my data. Let me know what you think. Thank you very much for taking the time to look at my plots and commenting on them. Let me know if you need additional information. 

Best,
Mustafa
BioSAXS Pic.png
Screen Shot 2020-08-02 at 11.21.23 AM.png

Sherik726

unread,
Aug 2, 2020, 11:25:09 AM8/2/20
to BioXTAS RAW
Hello Kusho,

I will check this out. Thank you for sending this to me. Highly informative.

Cheers,
Mustafa

Richard


To unsubscribe from this group and stop receiving emails from it, send an email to bioxt...@googlegroups.com.


To view this discussion on the web visit https://groups.google.com/d/msgid/bioxtas_raw/1561abf4-2411-4cd3-99dc-dcbda041db5eo%40googlegroups.com.
<Screen Shot 2020-07-30 at 11.04.29 AM.png>

--
You received this message because you are subscribed to the Google Groups "BioXTAS RAW" group.

To unsubscribe from this group and stop receiving emails from it, send an email to bioxt...@googlegroups.com.

--
You received this message because you are subscribed to the Google Groups "BioXTAS RAW" group.

To unsubscribe from this group and stop receiving emails from it, send an email to bioxt...@googlegroups.com.

Jesse Hopkins

unread,
Aug 3, 2020, 10:45:34 AM8/3/20
to bioxt...@googlegroups.com
Hi Mustafa,

You really want to be using the standard Dimensionless Kratky plot (in RAW, called the Dimensionless (Rg) plot, which is the default plot when opening the Normalized Kratky Plots window). Based on what you have plotted, I'd guess that the green is significantly flexible, but it would be better to see the Dimensionless Kratky plot.

Your P(r) functions still look truncated. If you're seeing the effects of aggregation strong enough that you can't find a good Dmax, you need to take the data over again. That's going to influence everything, from Rg to M.W. to reconstructions. This data could be useful for planning the next round of experiments, but I certainly wouldn't trust any modelling done with it (such as bead model reconstructions or any kind of flexibility modeling). You might want to talk with the beamline scientist wherever you collected the data first, and get their opinion on the analysis, before deciding your next steps. If they also think it's aggregated then you'll need to recollect the data.

Given that you're seeing aggregation, you should probably run the samples using SEC-SAXS, instead of batch mode SAXS. If you did use SEC-SAXS for the initial data collection, then you may need a different choice of column and/or to optimize your buffer conditions or add additional purification steps prior to running the experiment. You might find this video useful:

All the best.

- Jesse

----
Jesse Hopkins, PhD
Beamline Scientist
BioCAT, Sector 18
Advanced Photon Source

--
You received this message because you are subscribed to the Google Groups "BioXTAS RAW" group.
To unsubscribe from this group and stop receiving emails from it, send an email to bioxtas_raw...@googlegroups.com.
To view this discussion on the web visit https://groups.google.com/d/msgid/bioxtas_raw/131d6e4f-d7bc-4812-8697-d721565ce539o%40googlegroups.com.

Sherik726

unread,
Aug 8, 2020, 5:54:16 PM8/8/20
to BioXTAS RAW
Hello,

Thank you for your suggestions and help. We definitely will be coming back in the future to redo the same experiments and compare it to the data we currently have. Thank you all for your insight.

Cheers,
Mustafa
Reply all
Reply to author
Forward
0 new messages