Dissimilarity matrices
51 views
Skip to first unread message

Josué Anderson R. Azevedo
Dec 20, 2018, 8:02:33 AM12/20/18
to Biodiverse Users
Dear Shawn Laffan,
Thanks for Biodiverse! It was a wonderful way of accessing biodiversity patterns!
I've been visually testing the results of the turnover metrics in Biodiverse, with especial interest in the RW_turnover.
However, I've not been able to export pair-wise dissimilarity matrices. All I could get from the export menu were the values being displayed per cell like this:
ELEMENT,Axis_0,Axis_1,NEST_RESULTANT,RW_TURNOVER,RW_TURNOVER_A,RW_TURNOVER_B,RW_TURNOVER_C,SORENSON
-4250000:-2350000,-4250000,-2350000,0.300911854103343,0.931818181818182,6,8,74,0.872340425531915
-4450000:-1750000,-4450000,-1750000,0.617142857142857,0.863636363636364,12,2,74,0.76
How can I solve this?
Thanks!

Shawn Laffan
Dec 21, 2018, 10:00:18 PM12/21/18
to biodiver...@googlegroups.com
Hello Josué,
I'm glad to hear you find it useful.
It looks like you are running a spatial analysis in which you calculated a number of turnover indices. These give you the rate of turnover between the set of labels groups (cells) in neighbor set 1, compared with the set of labels found in neighbour set 2. These are turnover surfaces rather than matrices.
To generate a pair-wise matrix of turnover values you need to run a cluster analysis, optionally skipping the step to run the cluster analysis itself. You can then explore the results by clicking on individual cells to see the rate of turnover between that cell and each other cell in the data set.
The process is described in http://www.mssanz.org.au/modsim2011/E3/laffan.pdf , but without detailed steps.
Rather than provide such steps here, I have added a blog post to describe the process.
https://biodiverse-analysis-software.blogspot.com/2018/12/visualise-matrices-of-spatial-turnover.html
Note that the matrices can only be calculated for one index at a time, so if you want five indices then you will need to generate five matrices.
Hopefully that helps, and please let me know if you need more details or have further questions.
Regards,
Shawn.
--
You received this message because you are subscribed to the Google Groups "Biodiverse Users" group.
To unsubscribe from this group and stop receiving emails from it, send an email to biodiverse-use...@googlegroups.com.
To post to this group, send email to biodiver...@googlegroups.com.
To view this discussion on the web visit https://groups.google.com/d/msgid/biodiverse-users/d30484e3-2039-4766-ba35-c94980ba48eb%40googlegroups.com.
For more options, visit https://groups.google.com/d/optout.
--
Assoc Prof Shawn Laffan
  School of Biological, Earth and Environmental Sciences
  UNSW, Sydney 2052, Australia
  Tel +61 2 9385 8093
  http://www.bees.unsw.edu.au/staff/shawn-laffan
  https://shawnlaffan.github.io/biodiverse (free diversity analysis software)

  Editor, International Journal of Geographical Information Science
  http://www.tandf.co.uk/journals/ijgis

  UNSW CRICOS Provider Code 00098G
Josué Anderson R. Azevedo
Dec 27, 2018, 6:59:23 AM12/27/18
to biodiver...@googlegroups.com
Thank you for the explanation! I could now generate the pairwise matrices!
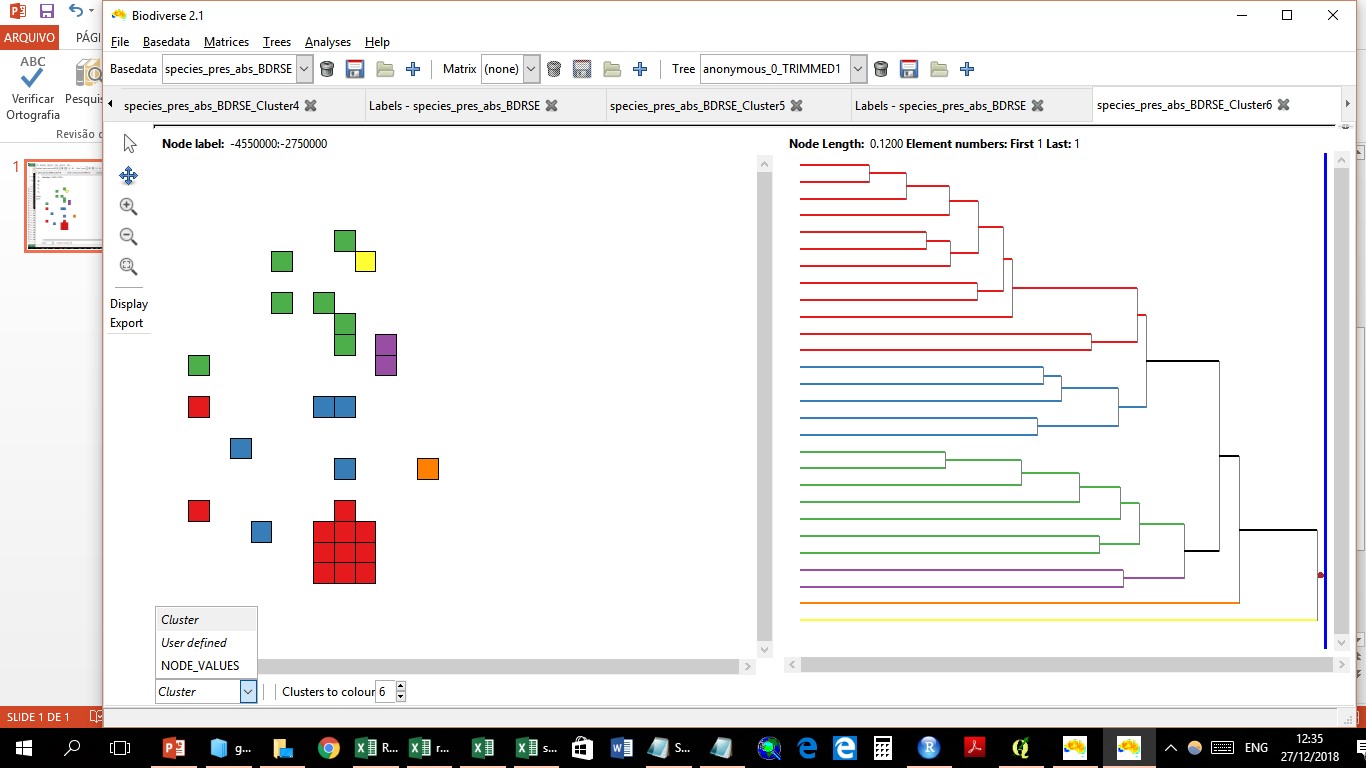
After spend sometime exploring the results, the only thing I still couldn't do was to visualize the turnover for each element as shown in the video. I got only the option of visualising the different clusters as shown in the screenshot.
I do have one more question (maybe for another topic?). Is it possible to run the analyses for a distribution of phylogenies using the GUI? I have managed to do it using the biodiverse pipeline in R for phylogenetic diversity, getting median values per grid cell for 100 different phylogenies. This would be very useful in the case of calculating RW Phylogentic turnover.
Thanks again!
Josué
To view this discussion on the web visit https://groups.google.com/d/msgid/biodiverse-users/b277efd1-8dcd-24e6-f1a1-58638ede48d5%40unsw.edu.au.
For more options, visit https://groups.google.com/d/optout.
Josué Anderson R. Azevedo
University of Gothenburg, Sweden
Department of Biological and Environmental Sciences
Antonelli Research Group
Shawn Laffan
Dec 27, 2018, 10:10:03 PM12/27/18
to biodiver...@googlegroups.com
Hello Josué,
You can open the matrix from the outputs tab. I need to update the blog post to show this.
WRT your other question, the GUI currently only runs one tree at a time. I have scripts that can run multiple analyses, but not the matrices at this stage.
Feel free to list it as an issue using the issue tracker - https://github.com/shawnlaffan/biodiverse/issues/
Regards,
Shawn.
To view this discussion on the web visit https://groups.google.com/d/msgid/biodiverse-users/CAEpkrKHCZ_mxVAmDs%3D6PF1nuwsD6-rkZkFAddLKRPBBJA8tD%2Bw%40mail.gmail.com.
For more options, visit https://groups.google.com/d/optout.
Reply all
Reply to author
Forward
0 new messages