New visualization tool for Google benchmark
788 views
Skip to first unread message

gaujay
Dec 1, 2019, 11:16:46 AM12/1/19
to benchmark-discuss
Hello everyone,
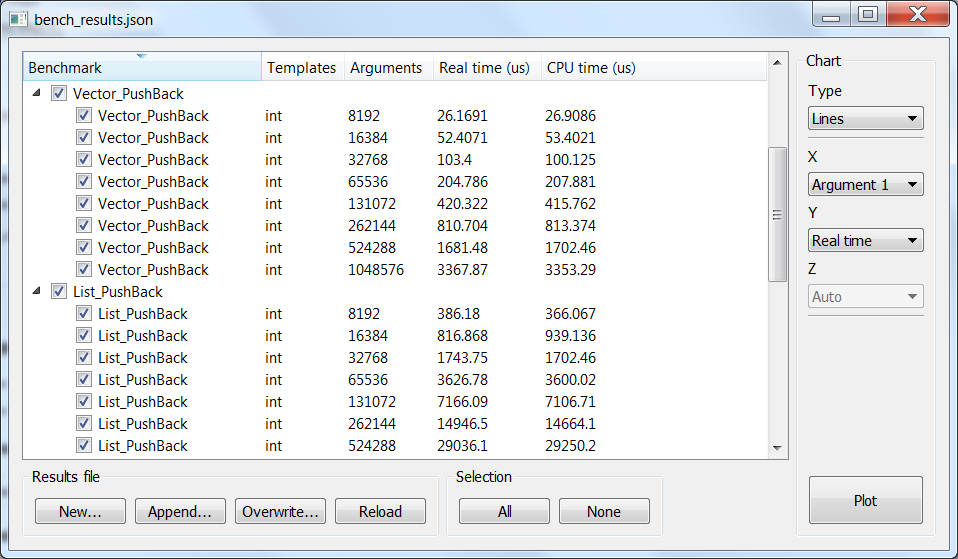
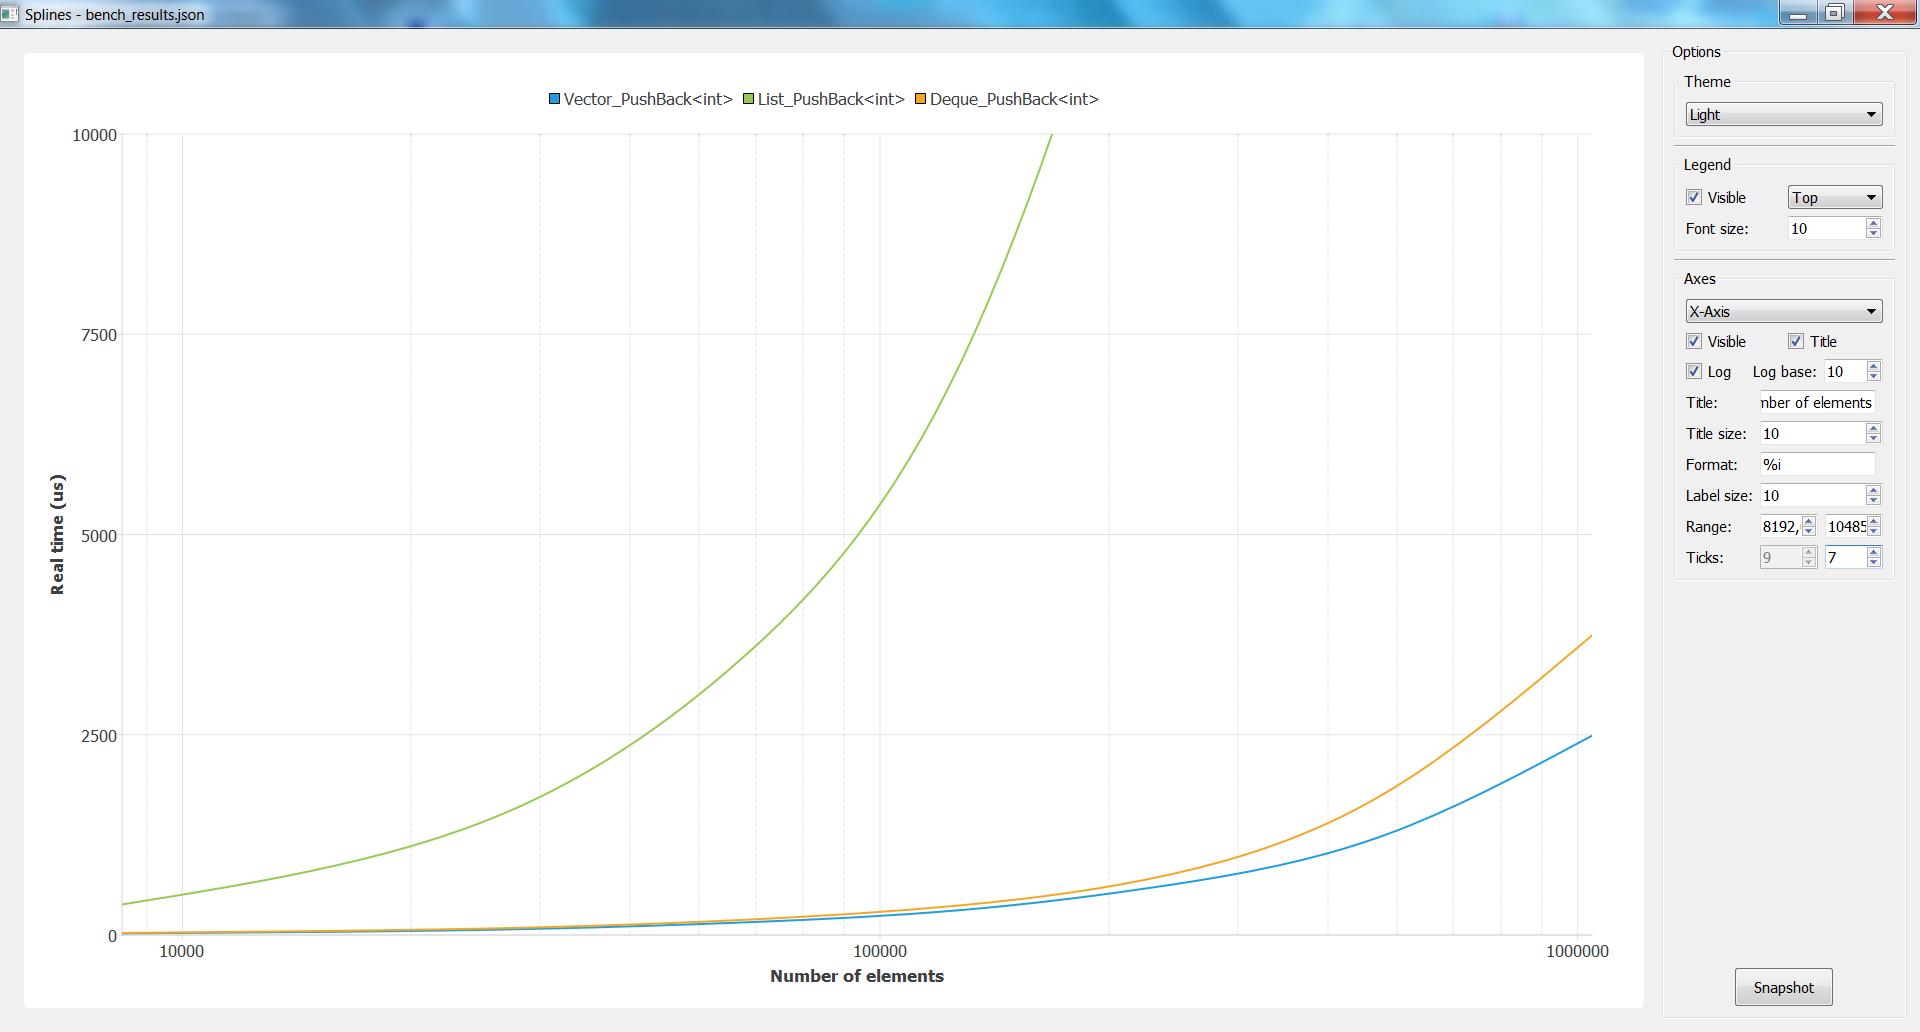
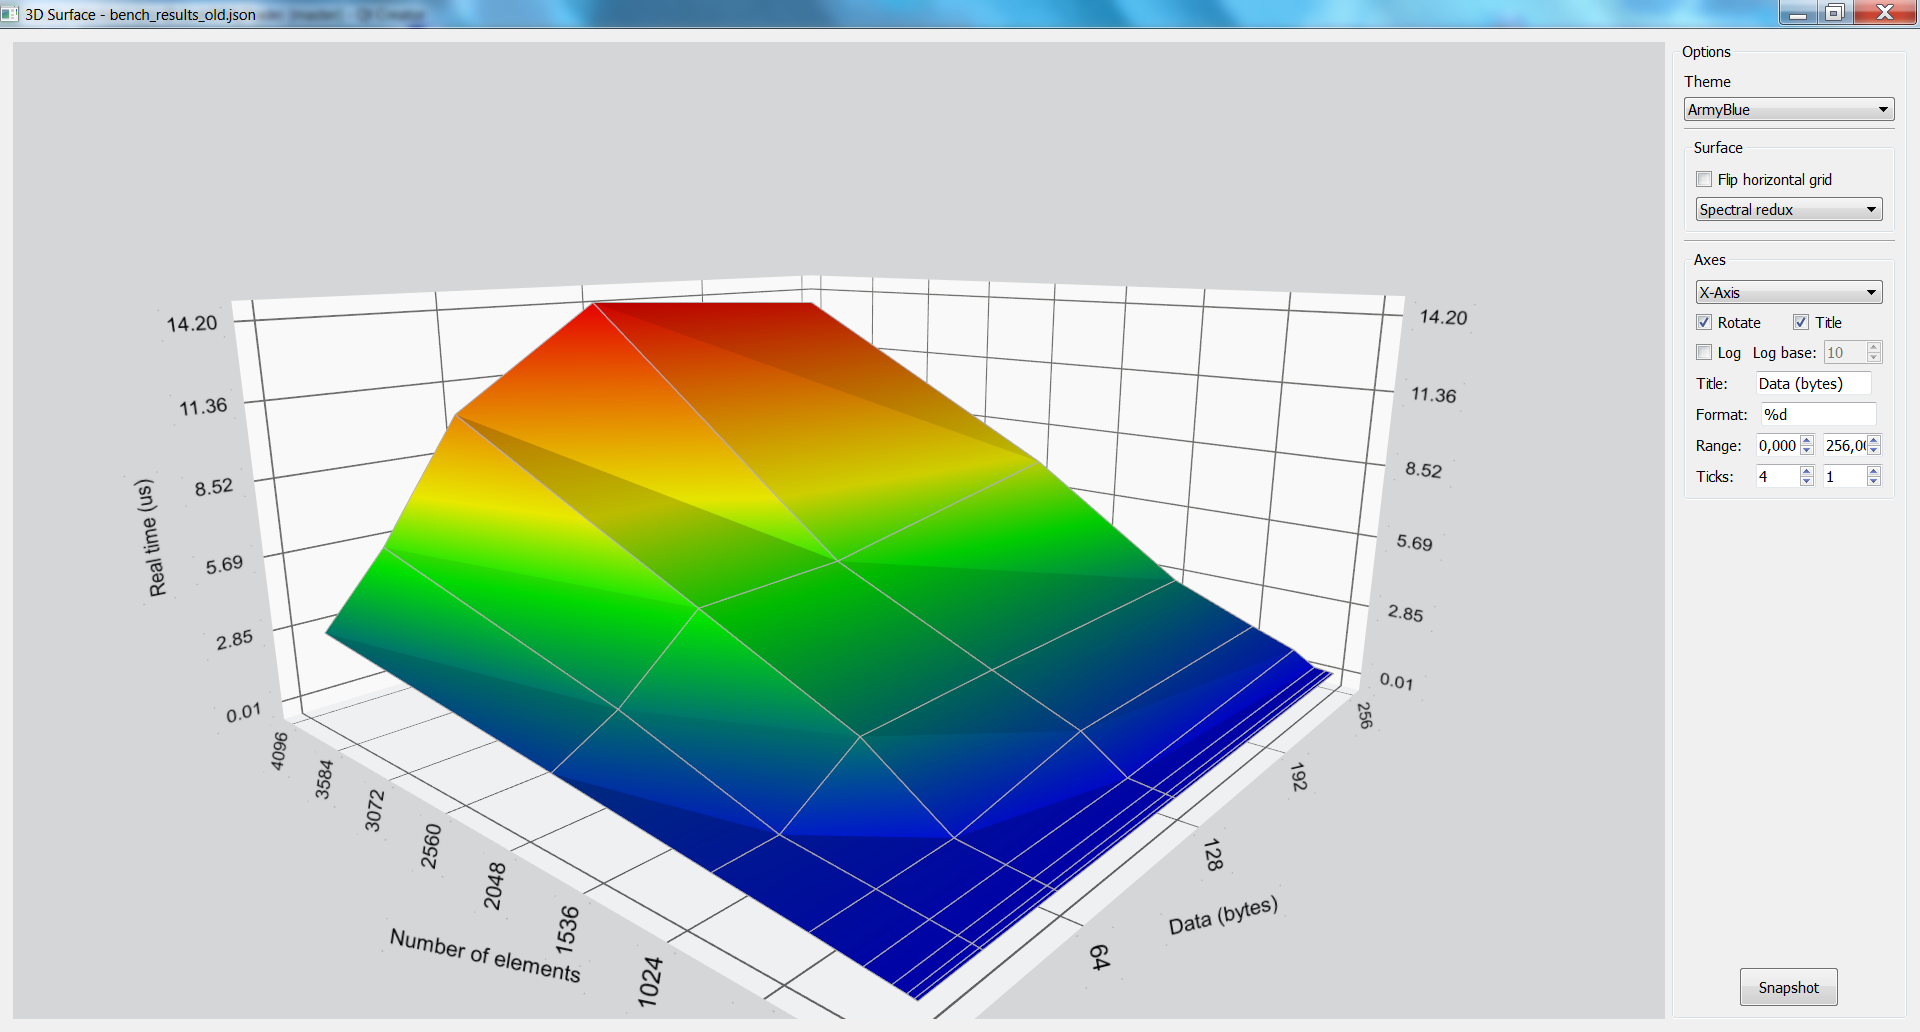
I developed a new tool to help visualize benchmark results as 2D and 3D charts.
Built upon Qt5 Charts and DataVisualization modules, it is freely available under GPLv3:
Features
- Parse Google benchmark results as json files
- Support old naming format and aggregate data (min, median, mean)
- Multiple 2D and 3D chart types
- Benchmarks and axes selection
- Plotting options (theme, ranges, logarithm, ...)
- Command line direct plotting
I was looking for some feedback before moving forward, as I plan to add some benchmarking automation features in the future.
As a standard C++11 CMake project with only Qt5 as dependency, you should be able to build and run it on Windows, Linux and Mac (only tested on the former so far).
As a standard C++11 CMake project with only Qt5 as dependency, you should be able to build and run it on Windows, Linux and Mac (only tested on the former so far).
Thanks.


Dominic Hamon
Dec 2, 2019, 6:01:26 AM12/2/19
to gaujay, benchmark-discuss
Hi
This is looking great. It works under linux too, btw, with a couple of qt5-dev libraries installed. I wanted to do something like this with HTML but using qt5 for plotting is a fab way of getting a cross platform solution.
--
You received this message because you are subscribed to the Google Groups "benchmark-discuss" group.
To unsubscribe from this group and stop receiving emails from it, send an email to benchmark-disc...@googlegroups.com.
To view this discussion on the web visit https://groups.google.com/d/msgid/benchmark-discuss/a943edbe-bcb3-4db8-bf4e-be07777dfac2%40googlegroups.com.
gaujay
Dec 2, 2019, 2:12:26 PM12/2/19
to benchmark-discuss
Hi Dominic,
Thanks for your feedback.
Happy to know it works well for you and on Linux too.
I hope it will help the Google community play around with benchmark results more easily.
If you have feature or bug requests in the future, please let me know.
On Monday, December 2, 2019 at 12:01:26 PM UTC+1, Dominic Hamon wrote:
HiThis is looking great. It works under linux too, btw, with a couple of qt5-dev libraries installed. I wanted to do something like this with HTML but using qt5 for plotting is a fab way of getting a cross platform solution.
On Sun, Dec 1, 2019 at 4:16 PM gaujay <guillau...@gmail.com> wrote:
--Hello everyone,I developed a new tool to help visualize benchmark results as 2D and 3D charts.Built upon Qt5 Charts and DataVisualization modules, it is freely available under GPLv3:Features
- Parse Google benchmark results as json files
- Support old naming format and aggregate data (min, median, mean)
- Multiple 2D and 3D chart types
- Benchmarks and axes selection
- Plotting options (theme, ranges, logarithm, ...)
- Command line direct plotting
I was looking for some feedback before moving forward, as I plan to add some benchmarking automation features in the future.
As a standard C++11 CMake project with only Qt5 as dependency, you should be able to build and run it on Windows, Linux and Mac (only tested on the former so far).Thanks.
You received this message because you are subscribed to the Google Groups "benchmark-discuss" group.
To unsubscribe from this group and stop receiving emails from it, send an email to benchmar...@googlegroups.com.
Reply all
Reply to author
Forward
0 new messages