Showing table values for the plotter
24 views
Skip to first unread message

choy tuck wai
Nov 6, 2020, 2:53:53 AM11/6/20
to bcvtb
Hi,
May I check with you if the plotter is able to show its value in the form of a table instead of a graph?

Christopher Brooks
Nov 6, 2020, 11:10:02 AM11/6/20
to bc...@googlegroups.com, choy tuck wai
BCVTB uses Ptplot. Ptplot does not have a table viewer.
BCVTB is based on Ptolemy II. Ptolemy II has a MatrixViewer actor. It looks like BCVTB includes ptolemy/actor/lib/matrix.xml which in turn includes ptolemy.actor.lib.gui.MatrixViewer
So, look for the MatrixViewer.
_Christopher
On 11/5/20 11:53 PM, choy tuck wai
wrote:
Hi,
May I check with you if the plotter is able to show its value in the form of a table instead of a graph?
--
You received this message because you are subscribed to the Google Groups "bcvtb" group.
To unsubscribe from this group and stop receiving emails from it, send an email to bcvtb+un...@googlegroups.com.
To view this discussion on the web visit https://groups.google.com/d/msgid/bcvtb/a760eddd-73ab-48b4-8b48-c7f27bc69ef8n%40googlegroups.com.
choy tuck wai
Nov 8, 2020, 8:04:03 AM11/8/20
to bcvtb
Thank you for your reply.
May I check with you how do I use the matrix viewer since it only have a single input port. Previously, as I have 6 variables to show their data value such as zone air temperature, relative humidity etc, I connect all of them to the plotter but now when I try do it for the matrix viewer, it says it only allow one single input port. how do I connect them to the matrix viewer? The matrix viewer also mentioned about matrix token, may I know what that?
Christopher Brooks
Nov 8, 2020, 1:45:20 PM11/8/20
to bc...@googlegroups.com, choy tuck wai
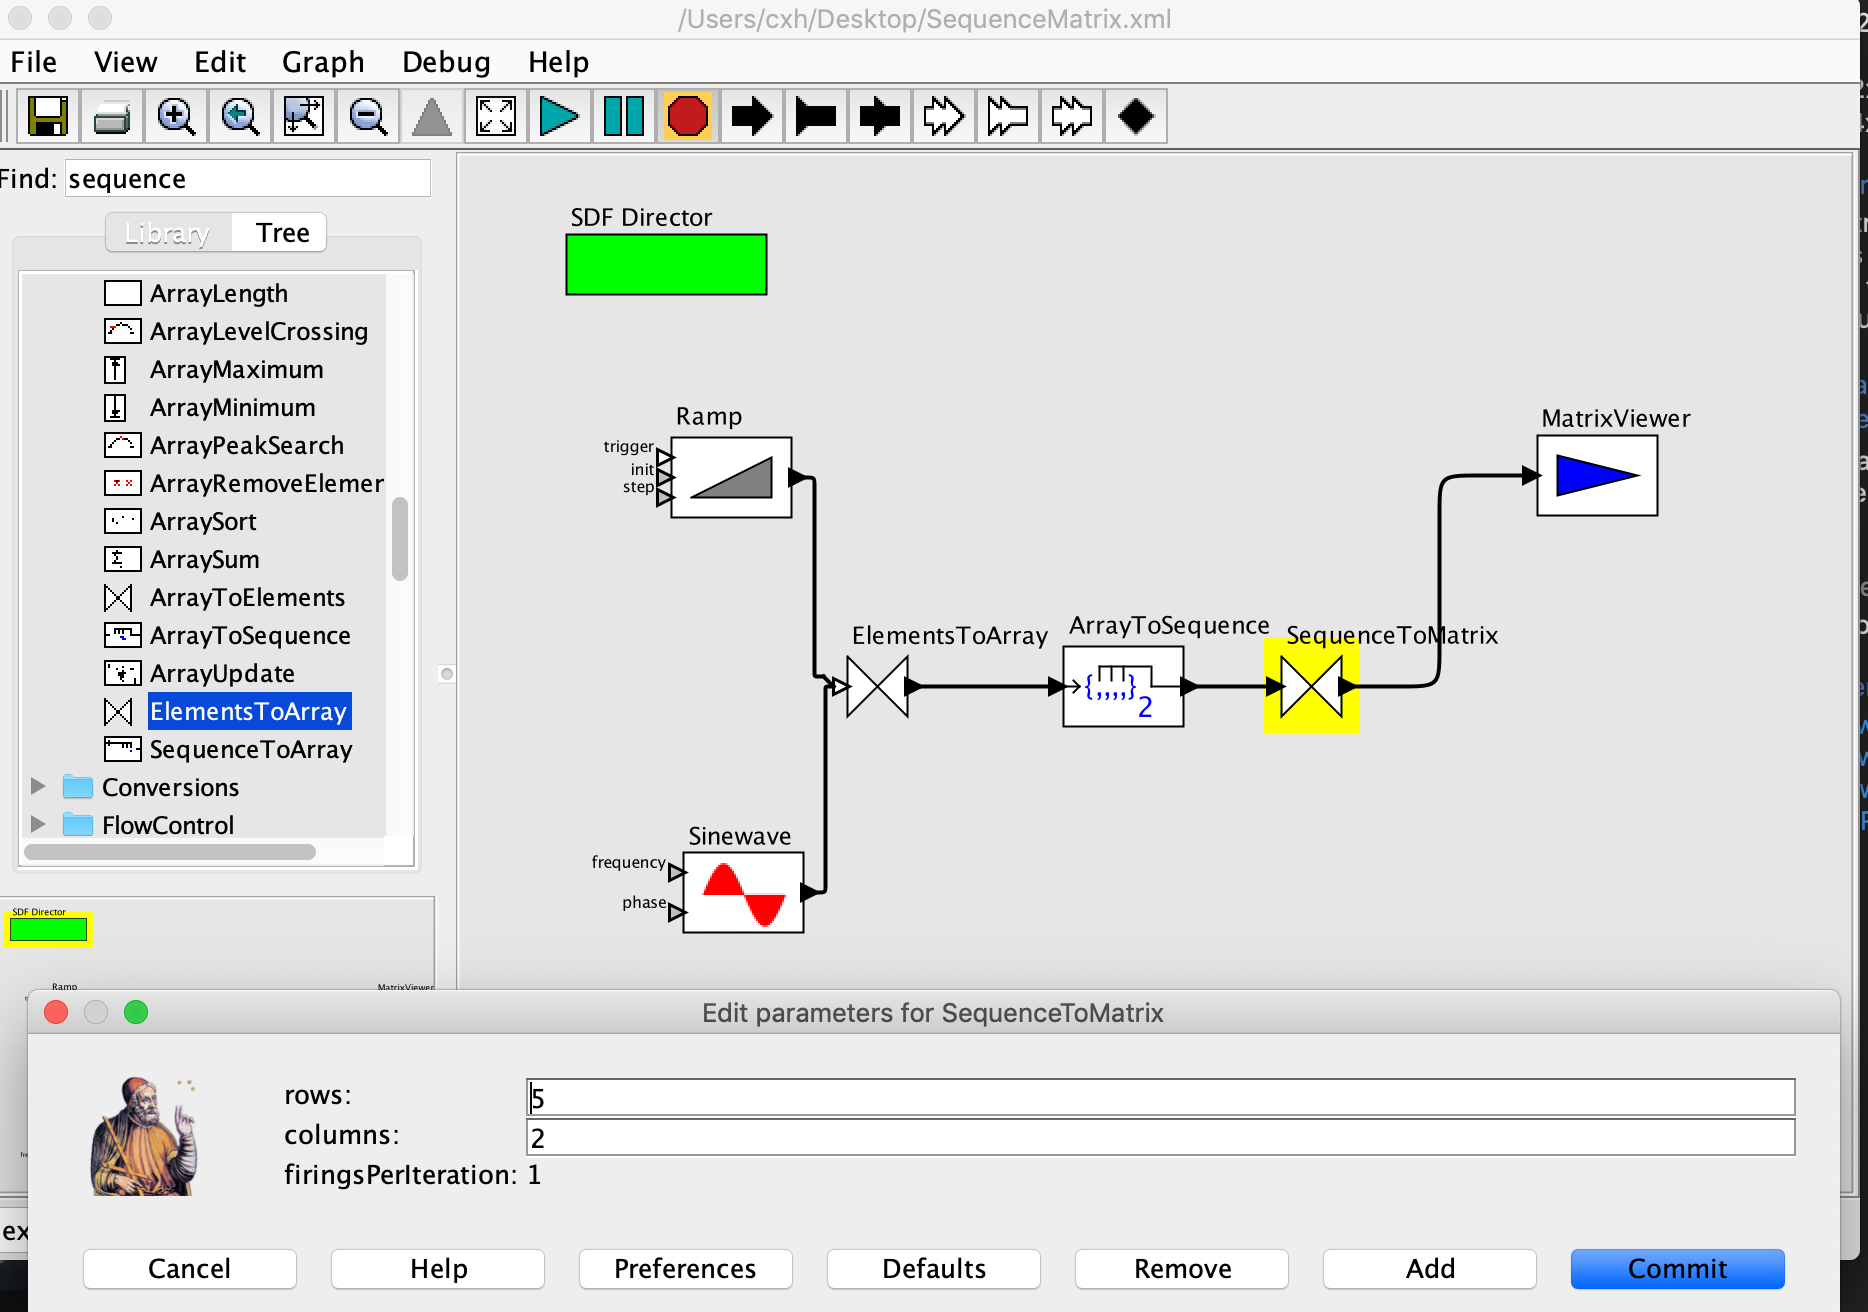
Here's a lame version that displays a matrix of a ramp and a sinewave.
_Christopher
To view this discussion on the web visit https://groups.google.com/d/msgid/bcvtb/b9a24537-974c-40d3-a41a-997c7a279ef9n%40googlegroups.com.
Reply all
Reply to author
Forward
0 new messages