Question on Strange BBR Behavior

375 views
Skip to first unread message

Sam Kumar

unread,
May 14, 2022, 12:09:49 PM5/14/22
to BBR Development

Hello bbr-dev,

I’m measuring the performance of BBR TCP when used to transfer data between different cloud regions, and I noticed some strange performance characteristics that I want to ask about in this forum.

Usually, BBR flows are very fast, several Gbit/s, and significantly outperform loss-based congestion control like CUBIC. However, between certain pairs of cloud regions, a BBR flow routinely gets “stuck” in a state where it sends out data very slowly, at only about 100 Kbit/s. Once BBR is in this state, it can remain in this state for hours before recovering and making progress as normal.

Here is an example of 25 trials of transferring 40 GiB from Google Cloud’s europe-north1 region (Finland) to AWS’ ap-southeast-1 region (Singapore):

bbr_email_example.png

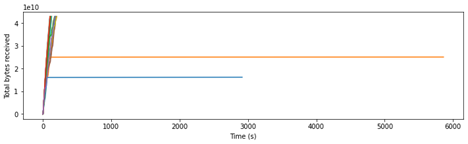
Each trial is represented as a separate curve, and each curve shows how the TCP connection made progress. As you can see, two of the flows failed to complete, instead getting stuck in a bad state. After waiting for a long time, I stopped those trials early—that is why they never reach 40 GiB transferred.

I did some cursory analysis with ss -tin, and it seems that BBR remains stuck in this state because, when the pacing rate increases beyond about 1 Mbit/s, the delivery rate decreases. Based on my understanding of BBR, backing off and remaining at low bandwidth seems like correct operation of the BBR algorithm.

I’m unsure whether this is an issue with the network or an issue with BBR. I’m wondering if any of the folks in this forum can provide some guidance?

Thanks,

Sam Kumar


By the way, I ran BBR by doing the following:

1.       I am running Ubuntu 20.04. On Google Cloud, this uses Linux 5.13.0-1024-gcp. On AWS, this uses Linux 5.11.0-1022-aws.

2.       I set changed sysctl parameters as follows:
net.core.rmem_max = 2147483647
net.core.wmem_max = 2147483647
net.ipv4.tcp_rmem = 4096 87380 2147483647
net.ipv4.tcp_wmem = 4096 65536 2147483647
net.ipv4.tcp_mem = 8388608 8388608 8388608
net.ipv4.tcp_keepalive_time = 240
net.ipv4.tcp_keepalive_intvl = 65
net.ipv4.tcp_keepalive_probes = 5

3.       I ran a simple C program that transfers data over TCP. It repeatedly calls write on the file descriptor to send out data on one VM and read to receive data on the other VM. It issues TCP_INFO system calls periodically from another thread to measure TCP progress and state.

4.  Here is the output of ss -tin on the sending node for a transfer that has stalled. As you can see, there is data in the send buffer to send out.
ESTAB        0             1328486296                    10.0.0.4:57001               18.228.192.119:57001
         bbr wscale:14,14 rto:620 rtt:310.914/0.067 mss:1448 pmtu:1500 rcvmss:536 advmss:1448 cwnd:10 ssthresh:10298 bytes_sent:12933690937 bytes_retrans:840863736 bytes_acked:11556415602 segs_out:8932114 segs_in:110155 data_segs_out:8932112 bbr:(bw:96664bps,mrtt:310.86,pacing_gain:1,cwnd_gain:2) send 372579bps lastsnd:232 lastrcv:297088 lastack:232 pacing_rate 95696bps delivery_rate 74520bps delivered:8106021 app_limited busy:297088ms rwnd_limited:122508ms(41.2%) unacked:370451 retrans:1/580707 lost:245551 sacked:124899 dsack_dups:167 reordering:300 reord_seen:6 rcv_space:14480 rcv_ssthresh:65535 notsent:792074696 minrtt:310

Neal Cardwell

unread,
May 14, 2022, 4:17:33 PM5/14/22
to Sam Kumar, BBR Development
Hi Sam,

Thanks for the detailed report! Based on the details in your ss output, I think we can put together a patch that we think should fix the issue. I believe this buggy behavior is due to a buggy interaction between TCP loss recovery and tracking of application-limited bandwidth samples.

If we provided a kernel patch to fix this, would you be willing/able to test the fix in your setup, to verify that the patch fixes the issue?

For the baseline kernel (without the patch) I think the recipe would be:

I think the bug is on the TCP sender, and in your case the baseline sender kernel is Linux 5.13.0-1024-gcp, whose sources I think are at:

And it seems you could build your kernel with this SHA1:
  a4ce0500c (tag: applied/5.13.0-1024.29_20.04.1) 5.13.0-1024.29~20.04.1 (patches applied)
If you can get that kernel to build and boot on your GCP VM then we can provide a source patch that I expect should fix the buggy behavior.

If testing a kernel patch would not be feasible, then we can consider other approaches to test the fix, if you are open to that. :-)

Thanks!
neal


--
You received this message because you are subscribed to the Google Groups "BBR Development" group.
To unsubscribe from this group and stop receiving emails from it, send an email to bbr-dev+u...@googlegroups.com.
To view this discussion on the web visit https://groups.google.com/d/msgid/bbr-dev/3ac326df-5c28-4257-94bc-360e3dae604fn%40googlegroups.com.

Damien Claisse

unread,
Jun 3, 2022, 8:48:17 AM6/3/22
to BBR Development
Hi Neal,

I'm experiencing a very similar issue, during transfer of a ~300MB file, traffic sometimes become very slow, nearly stalled (down to 1mbps or less). Sender uses BRRv1 with 5.17 kernel, issue confirmed on multiple receivers using various OS (Linux and Windows).

I don't manage to reproduce it in very low latency situations, but it seems more reproducible when latency is quite high, e.g. from Paris to Singapore such as the following example.

When everything is ok, I have such ss -tie output:
ESTAB 0 3460099 10.251.251.41:https 10.176.4.25:34086 timer:(on,258ms,0) uid:188 ino:154458311 sk:2887da cgroup:unreachable:c19 <-> ts sack bbr wscale:10,10 rto:347 rtt:146.095/1.239 ato:40 mss:1448 pmtu:1500 rcvmss:536 advmss:1448 cwnd:7044 bytes_sent:259620271 bytes_acked:256160172 bytes_received:447 segs_out:179752 segs_in:8246 data_segs_out:179751 data_segs_in:3 bbr:(bw:192Mbps,mrtt:143.961,pacing_gain:2.88672,cwnd_gain:2.88672) send 559Mbps lastsnd:34 lastrcv:13989 lastack:50 pacing_rate 548Mbps delivery_rate 192Mbps delivered:177359 app_limited busy:14276ms sndbuf_limited:8114ms(56.8%) unacked:2393 rcv_space:14600 rcv_ssthresh:64076 minrtt:88.583

When it is KO, I have such output (and I can confirm I can use way more than 800kbps on the link during this transfer, for instance by doing an iperf test in parallel):
ESTAB 0 320008 10.251.251.41:https 10.176.4.25:60638 timer:(on,274ms,0) uid:188 ino:153369975 sk:286c10 cgroup:unreachable:c19 <-> ts sack bbr wscale:10,10 rto:308 rtt:107.169/22.214 ato:40 mss:1448 pmtu:1500 rcvmss:536 advmss:1448 cwnd:10 ssthresh:20 bytes_sent:7487810 bytes_acked:7474778 bytes_received:447 segs_out:5174 segs_in:2502 data_segs_out:5174 data_segs_in:3 bbr:(bw:803kbps,mrtt:0,pacing_gain:1,cwnd_gain:2) send 1.08Mbps lastsnd:21 lastrcv:70567 lastack:37 pacing_rate 795kbps delivery_rate 723kbps delivered:5166 busy:70855ms unacked:9 rcv_space:14600 rcv_ssthresh:64076 notsent:306976 minrtt:0.007

For some reason I don't understand yet, I'm only seeing it using 5.17 kernel, not in 5.16 or earlier versions. I didn't find anything that could explain why the probability of miscalculating available link bandwidth has raised in kernel 5.17 though, but maybe the issue is older. If I use other congestion control algorithms such as cubic, I don't reproduce this issue either.

We build our own kernel, so I may be interested in testing any patch that could fix the issue.

Thanks,

Damien Claisse
Reply all
Reply to author
Forward
0 new messages