Strong mapping dependence on index files
113 views
Skip to first unread message

Toni Šarić
Jun 29, 2022, 4:33:44 AM6/29/22
to astrometry
Hi everyone, Dustin,
I am sure you are already familiar with the problem I am solving since I made a lot of questions already and all of them were successfully resolved with the help of Dustin.
Briefly, I am solving starfield in one part of the image(~70%) but the wcs solution I need to have on the entire image(30% of the image is obstructed).
After solving, astrometry gives me average mapping accuracy, measured as an offset on index stars vs. field stars, around 1.8 arcseconds with free to choose index file, and after verify on smallest index file(4210) I get around 3.35 arcseconds.
Then, in the obstructed part of the image, where I know I have a star, 13Comae(for example), with known RA&Dec coords, I am using the acquired wcs solution and astropy all_world2pix() method to transform 13Comae RA&Dec coordinates to pixels.
And the results are quite different. Pixel location of a star is shifting more than 2 pixels, roughly half arcminute since my resolution is 18.7 arcsecperpix, depending on which index file is used to solve starfield. You can see it in picture 1.1. Note, this is with applied tweak order 4.
If I use tweak order 2, the location is also shifting depending on index files(picture 1.2).
There is also a shift around 7 pixels(between picture 1.1 and picture 1.2) which can be explained due to different tweak orders. But I am puzzled by the shift depending on the index file. I assume it is due to no stars in that part of the image, therefore astrometry needs to extrapolate the wcs solution. But I don't understand why the shift is this much exaggerated since in both cases I have more than enough stars to solve starfield(>50).
I would like to know if there is a way to overcome this problem since a solution with this precision I can not trust and use.
BR
Toni

Dustin Lang
Jun 29, 2022, 9:13:53 AM6/29/22
to astrometry
Hi,
The SIP distortion representation is a polynomial, and polynomials are very bad at extrapolating, and this gets worse at higher order.
There is a python script to plot SIP distortion solutions (optionally, exaggerating the corrections) that may help you see what the solutions look like and how they extrapolate.
The script is astrometry/util/plotSipDistortion.py and you use it like
python3 plotSipDistortion.py -x 10 wcs.fits output.png
to exaggerate the distortion solution 10x.
Maybe if you post an example of the images you're trying to deal with, and maybe an explanation of what you're trying to do -- why do you care where a star is if it's in an obstructed part of the image?, that might help.
cheers,
dustin

Eric SIBERT
Jun 29, 2022, 9:27:30 AM6/29/22
to astro...@googlegroups.com
> The SIP distortion representation is a polynomial, and polynomials are very
> bad at extrapolating, and this gets worse at higher order.
https://en.wikipedia.org/wiki/Runge%27s_phenomenon
> bad at extrapolating, and this gets worse at higher order.
My 2 cents
Eric
Toni Šarić
Jun 29, 2022, 2:07:39 PM6/29/22
to astrometry
Thanks, Eric and Dustin.
I have installed astrometry via conda so plotSipDistortion.py is not included(at least to my knowledge). I will install the standard local version, and try the script. That would be really helpful to see real effect of distortion.
On the second point, I attached a sample image. On the left part of the image is starfield which I am trying to solve, and the right part is obstructed by another camera(PMT). You can see 6 LEDs, whose center represents telescope pointing, and at that center, tracked star should be, in this case, 13Comae. So I would like to know the sky coordinates of that point which would give me RA&Dec of telescope pointing.
P.S. If you try to solve the attached image by yourself, 13Comae will not be at the center of the LED circle, but shifted down and to the right, due to the parallax effect caused by the PMT camera(28m distance) and starfield(infinity).
BR
Toni
Toni Šarić
Jul 3, 2022, 12:32:53 PM7/3/22
to astrometry
I solved image with "--no-tweak" option and now, regardless of index file used, pixel position of a star of interest is the same. So, as you assumed, it is due to SIP.
I attached sample of solved image(only starfield is cropped, and it is plotted after solving with smallest index file), where we can see distortion is pretty large.
Toni Šarić
Jul 4, 2022, 4:14:19 PM7/4/22
to astrometry
Hi Dustin,
I managed to run plotSipDistribution. In case someone read this, both conda and a local install of astrometry don't include mentioned util, so you need to pull it from Dustin's GitHub.
I exaggerated correction 10x on all of my images. With the "no_tweak" option, as expected, there is no correction(picture output_free_notweak.png). And, as I mentioned in my previous post, arbitrary RA&Dec coordinate is located in the same pixels, regardless of which index file is used to solve starfield.
With tweak order 2, SIP correction is different and depends on chosen index file(pictures output_free_tw2.png, output_fixed_tw2.png).
The same thing is with tw=4, only increased effect.
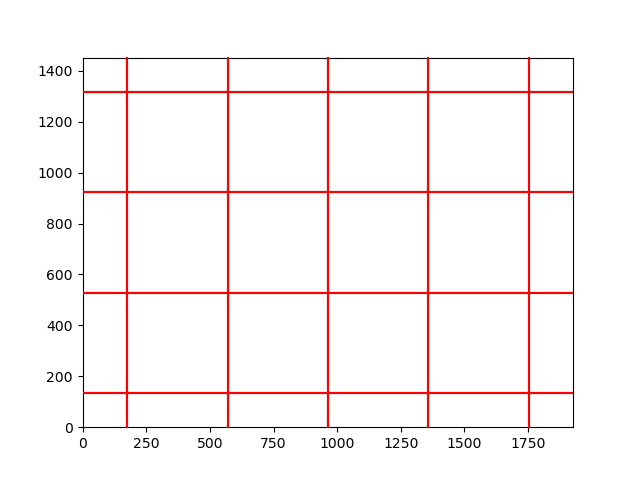
Dustin, if it is not too much to ask, what do the red lines represent (distortion correction)?
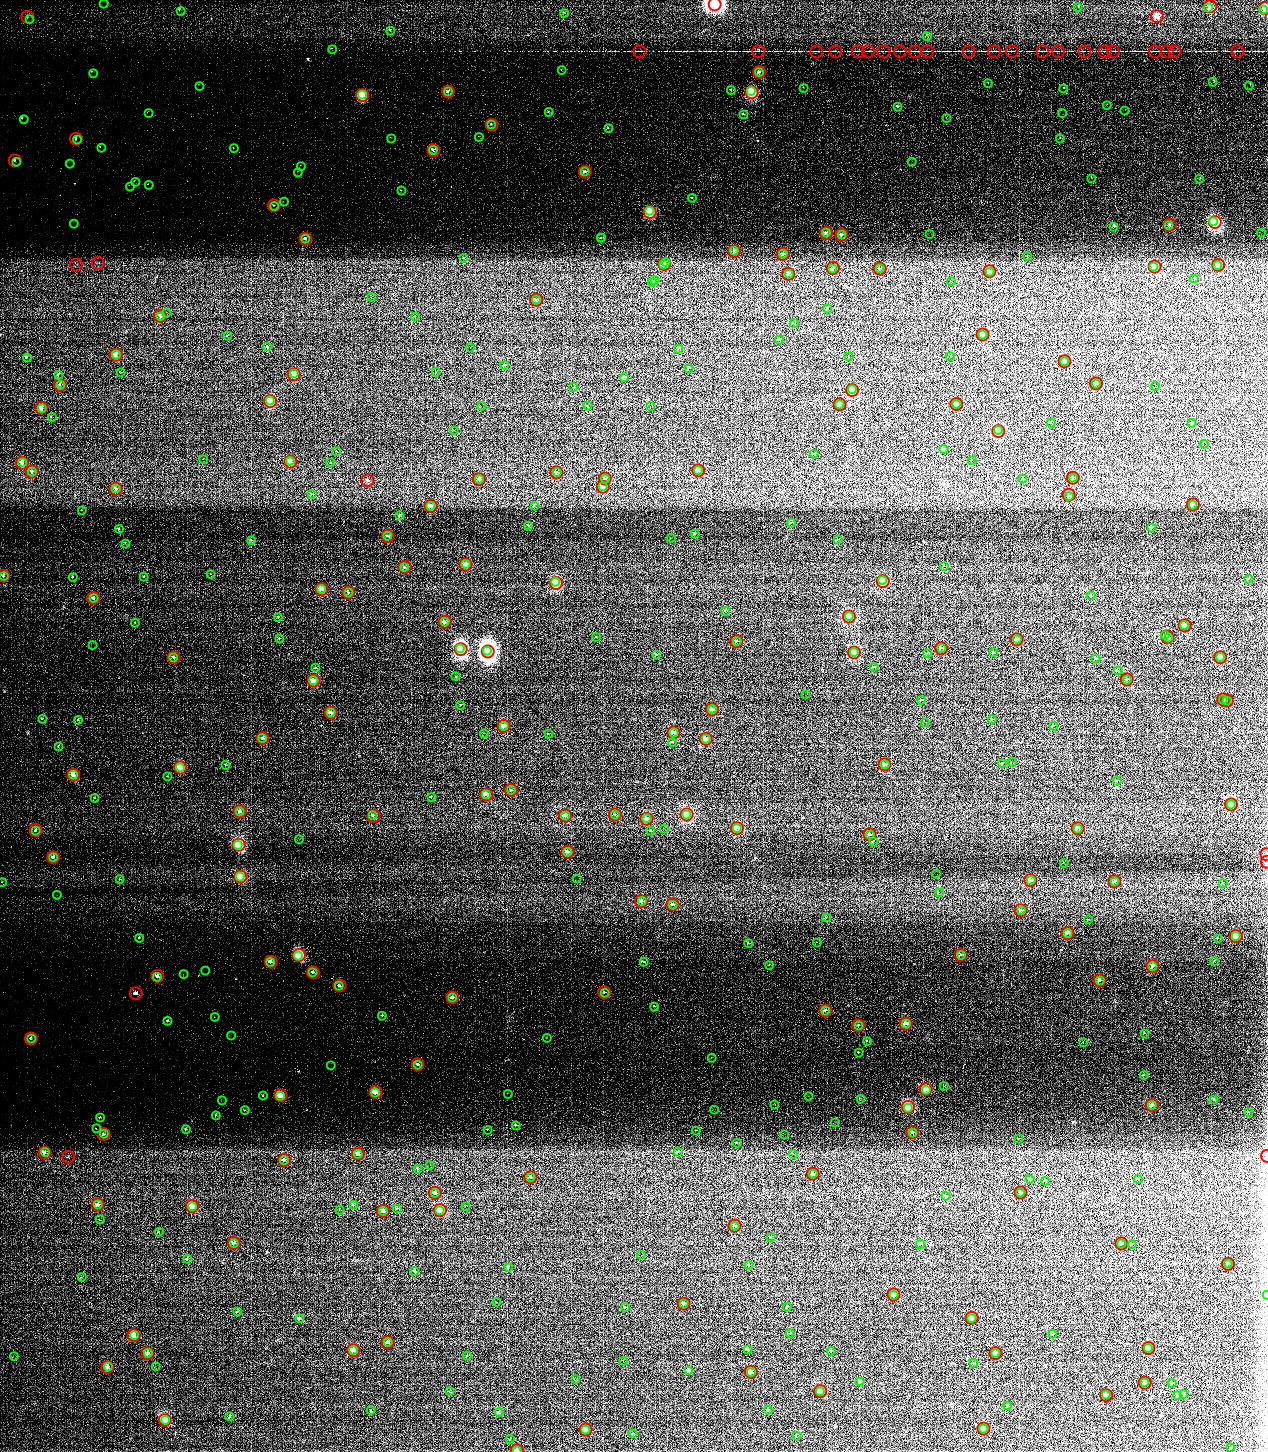
Because, in the index plot, after applying SIP corrections, green circles(where stars should be if there is no distortion) are shifted towards the end of the image, because distortion is causing the stars to appear further from the center of the image.
Now, looking at the SIP plot, red lines are moved toward the center.
I attached both index plots(with tw=2 and no tweak) and also SIP plots(with tw=2 and no tweak).
I managed to run plotSipDistribution. In case someone read this, both conda and a local install of astrometry don't include mentioned util, so you need to pull it from Dustin's GitHub.
I exaggerated correction 10x on all of my images. With the "no_tweak" option, as expected, there is no correction(picture output_free_notweak.png). And, as I mentioned in my previous post, arbitrary RA&Dec coordinate is located in the same pixels, regardless of which index file is used to solve starfield.
With tweak order 2, SIP correction is different and depends on chosen index file(pictures output_free_tw2.png, output_fixed_tw2.png).
The same thing is with tw=4, only increased effect.
Dustin, if it is not too much to ask, what do the red lines represent (distortion correction)?
Because, in the index plot, after applying SIP corrections, green circles(where stars should be if there is no distortion) are shifted towards the end of the image, because distortion is causing the stars to appear further from the center of the image.
Now, looking at the SIP plot, red lines are moved toward the center.
I attached both index plots(with tw=2 and no tweak) and also SIP plots(with tw=2 and no tweak).
Note: SIP plot contains whole image, but index plot is only left part, where starfield is.
BR
Toni
Dustin Lang
Jul 4, 2022, 5:01:11 PM7/4/22
to Toni Šarić, astrometry
If it's possible, what I would suggest for the task you're trying to solve is, remove your finder scope from where it is mounted so that you can take an image of the sky without the other scope obstructing it. If you can then get a deep image with a lot of stars, you could run solve-field (be sure to use --crpix-center) with a tweak order that makes sense. You can then take just the "tweak" part of the solution and apply it to your new images. This will take some experimenting. It's possible that the "solve-field --predistort" option will do the right thing (though it's not heavily tested).
cheers,
dsutin
--
You received this message because you are subscribed to the Google Groups "astrometry" group.
To unsubscribe from this group and stop receiving emails from it, send an email to astrometry+...@googlegroups.com.
To view this discussion on the web visit https://groups.google.com/d/msgid/astrometry/1303bc74-4ed5-4f5d-ad14-cb8204ac7175n%40googlegroups.com.
Message has been deleted
Toni Šarić
Jul 5, 2022, 7:36:27 AM7/5/22
to astrometry
That would be a smart thing to do, thanks.
What do you mean by "take just tweak part of the solution"? Is it possible to reuse SIP coefficients?
I
mean, if I solve an image, and the solution looks good, can I take SIP
coefficients and feed them into astrometry for every other image?
Or that could be done only with predistort option by feeding astrometry good .wcs solution, to every new image.
Dustin Lang
Jul 5, 2022, 8:06:55 AM7/5/22
to Toni Šarić, astrometry
Yes, exactly, you can take just the SIP part of a solution. The --predistort option was created for a situation where the distortion is strong enough that you wouldn't get a solution without first approximately un-distorting the star positions, so it takes an input WCS, un-distorts star positions, runs those positions through the solver, then re-distorts the solution. What I can't remember is whether it then always tunes up the solution (which I think you don't want, because you don't have any matched stars in that region). So it'll take some experimenting or digging through the code.
cheers,
dustin
You received this message because you are subscribed to a topic in the Google Groups "astrometry" group.
To unsubscribe from this topic, visit https://groups.google.com/d/topic/astrometry/wM3xoYSGnoQ/unsubscribe.
To unsubscribe from this group and all its topics, send an email to astrometry+...@googlegroups.com.
To view this discussion on the web visit https://groups.google.com/d/msgid/astrometry/5bd0281a-c7ca-4935-ae40-31c944b6eaf0n%40googlegroups.com.
Toni Šarić
Jul 6, 2022, 5:23:02 AM7/6/22
to astrometry
Thanks for explaining predistort, I get the idea behind it now, and how to proceed with it(solve good field, and then reuse .wcs with --predistort for other images).
Forgive my annoying questions, English is not my native, so sometimes it takes time, or multiple QA for me to understand the point.
The only part I didn't quite understand was how to take only the SIP part of the solution(or that was the procedure explained above).
Forgive my annoying questions, English is not my native, so sometimes it takes time, or multiple QA for me to understand the point.
The only part I didn't quite understand was how to take only the SIP part of the solution(or that was the procedure explained above).
If that does not work out, I will try to correct for distortion with some other tool, perhaps Hugin, and then feed astrometry with corrected star positions through .axy?!(just an idea for the moment)
Is it possible to give astrometry only SIP coefficients?
BR
Toni
Dustin Lang
Jul 6, 2022, 8:58:47 AM7/6/22
to Toni Šarić, astrometry
Hi,
Right, I think --predistort does what you want -- you find a good SIP solution with one image, and then pass that SIP solution to future solve-field runs.
cheers,
dustin
To view this discussion on the web visit https://groups.google.com/d/msgid/astrometry/e020193e-fc85-47a3-9d92-f40c1d5a1b24n%40googlegroups.com.
Toni Šarić
Jul 8, 2022, 4:04:30 AM7/8/22
to astrometry
Thanks Dustin for taking your time to help me.
Cheers
Toni Šarić
Oct 10, 2022, 3:32:22 PM10/10/22
to astrometry
Hi Dustin,
is it possible to give to predistort only SIP coefficients, not .wcs file?
Let's say I solved 1000 images, and I can calculate mean value for every A and B coefficient, then I want to give to predistort those mean values.
I was thinking about in case one can not find image with good SIP solution. If it is not possible, maybe easy solution would be to update single .wcs file with those calculated mean values.
Dustin Lang
Oct 10, 2022, 4:38:25 PM10/10/22
to Toni Šarić, astrometry
The --predistort option only uses the SIP coefficients (not the TAN part of the WCS header).
cheers,
dustin
To view this discussion on the web visit https://groups.google.com/d/msgid/astrometry/73aeddea-bde6-4ae1-a9f1-50a097eebfden%40googlegroups.com.
Toni Šarić
Oct 10, 2022, 5:49:45 PM10/10/22
to astrometry
I still don't understand how to give astrometry solve-engine only SIP coefficients; in which format? Create new empty fits and fill it only with coefficients?
I tried like this. I updated header of one .wcs file with the mean values for A, B, AP, BP coefficients, and then solved again set of images(2270images) with predistort option. The results are actually worse - mean separation between catalog and field stars went from 1.9'' up to 20arcseconds.
Obviously I did something wrong
Toni Šarić
Oct 10, 2022, 6:23:28 PM10/10/22
to astrometry
Actually, it looks like it does use TAN part of the header, since I got following error when tried to give to the predistort a fits file with only A,B,AP,BP
sip_qfits.c:380:sip_read_header SIP: failed to read TAN header
sip_qfits.c:496:tan_read_header TAN header: missing or invalid value for "CRVAL1"
Dustin Lang
Oct 11, 2022, 9:54:52 AM10/11/22
to Toni Šarić, astrometry
It requires the TAN header cards to exist (because it uses the standard code to read the WCS header), but doesn't use it.
To view this discussion on the web visit https://groups.google.com/d/msgid/astrometry/ad09891b-26dd-439e-90df-09571f30e803n%40googlegroups.com.
Reply all
Reply to author
Forward
0 new messages