Depending on index files, position of a star change
41 views
Skip to first unread message

Toni Šarić
Dec 18, 2021, 4:59:15 AM12/18/21
to astrometry
Hi everyone,
I am solving a set of images containing one particular star that should be in one specified pixel in all of my images.
After solving, I am plotting the X and Y position of that star(in pixel coordinates).
(I know RADec coordinates of that star, and I am using wcs to convert it to pixel position).
Depending on a chosen set of index files, I am seeing the different distribution of that star in pixel position.
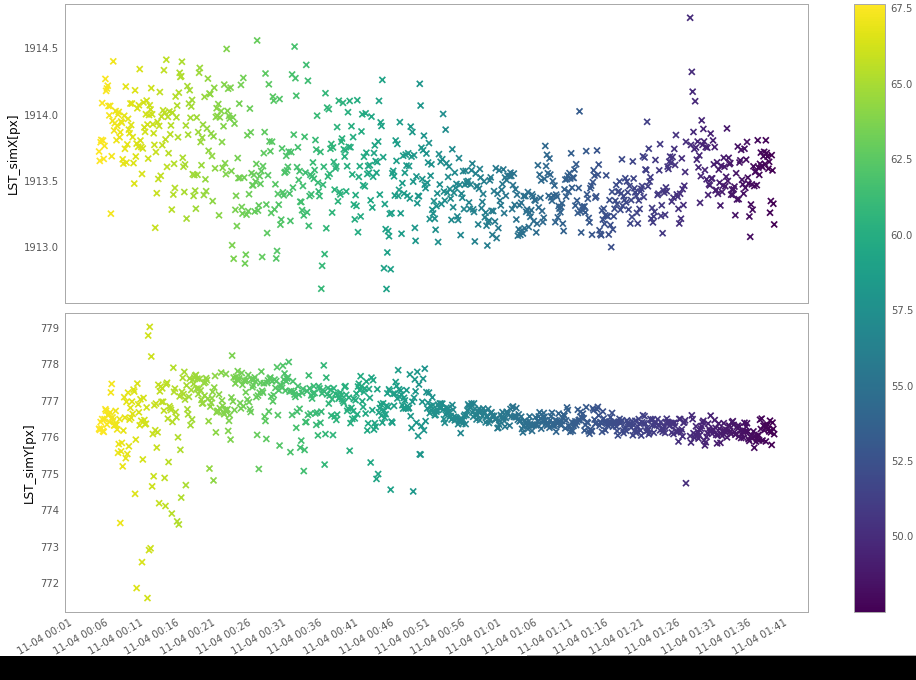
The first image(11.png) is when I let astrometry.net choose the best index file(from 42xx series) to solve for every image. We can observe two distributions in X(top panel) coordinates.
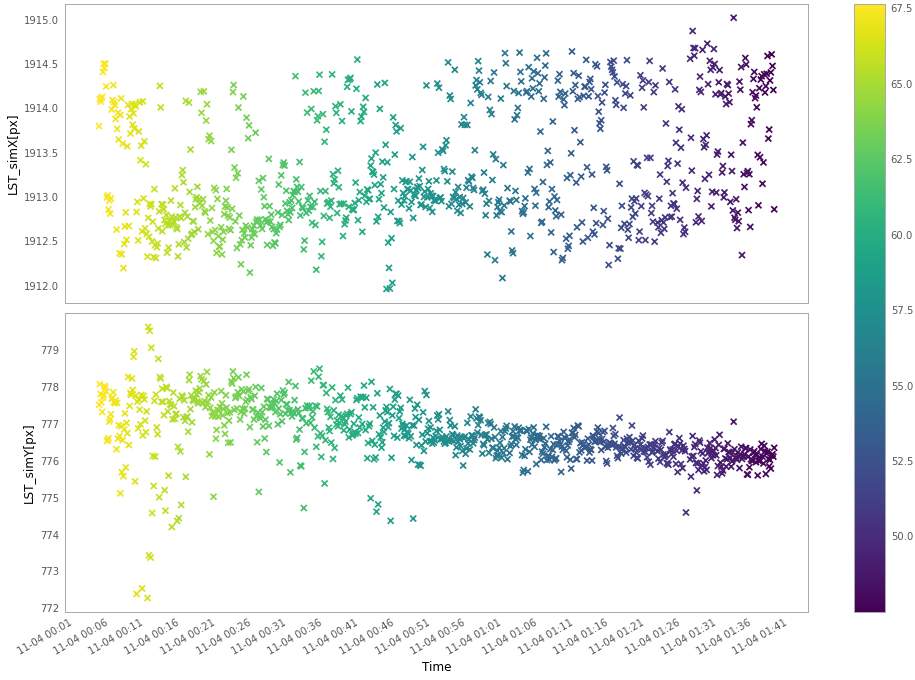
The second image(12.png) is when I fixed solving with only one index file(4210).
We don't see two distributions anymore, so I am guessing it was due to astrometry solving with different index files.
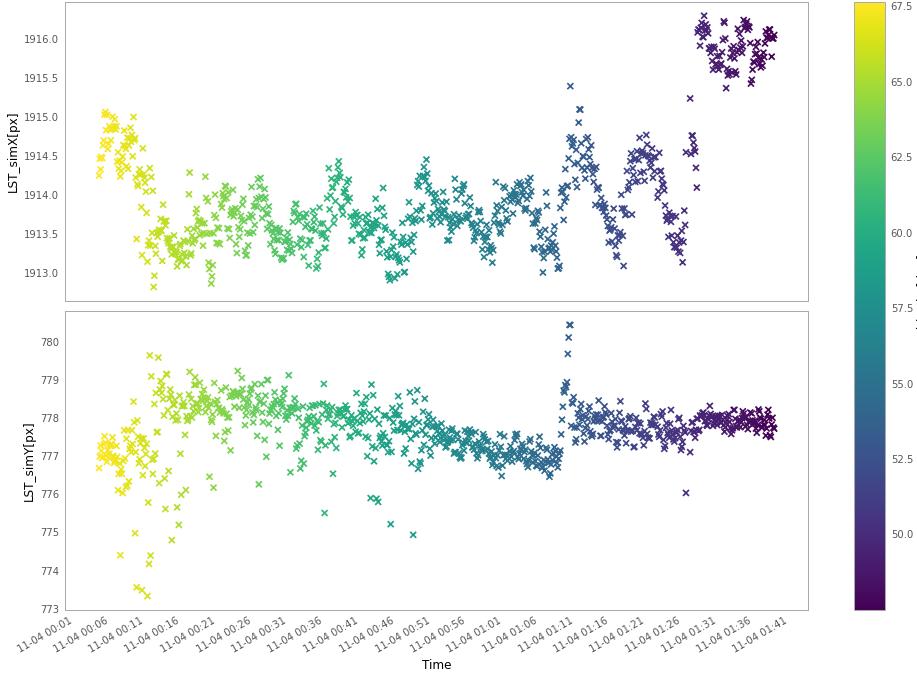
The third plot(13) is made when I am using different index files(41xx series).
I am solving a set of images containing one particular star that should be in one specified pixel in all of my images.
After solving, I am plotting the X and Y position of that star(in pixel coordinates).
(I know RADec coordinates of that star, and I am using wcs to convert it to pixel position).
Depending on a chosen set of index files, I am seeing the different distribution of that star in pixel position.
The first image(11.png) is when I let astrometry.net choose the best index file(from 42xx series) to solve for every image. We can observe two distributions in X(top panel) coordinates.
The second image(12.png) is when I fixed solving with only one index file(4210).
We don't see two distributions anymore, so I am guessing it was due to astrometry solving with different index files.
The third plot(13) is made when I am using different index files(41xx series).
Now we see some sort of wave-like behavior.
I want distribution of that star to be as narrow as possible.
What do you think I can do?
BR
Toni

Bryan
Dec 18, 2021, 2:02:07 PM12/18/21
to astrometry
Toni
Does the RA/Dec change in the various solved outputs or does the pixel position change only when you convert to X,Y?
Bryan

Dustin Lang
Dec 19, 2021, 11:07:36 AM12/19/21
to Toni Šarić, astrometry
Hi,
I can definitely see how you would get slightly different positions for an RA,Dec position given different index files. The index files contain different numbers of stars, so the WCS solution is going to be the result of matching a different set of stars.
I have no idea why you are seeing that oscillating behavior for the 4100-series index. No idea. Are you using solve-field directly on your images? Or passing in X,Y lists of detected stars?
If you want the most stable results, you may indeed want to use a fixed index file. Another option would be to run solve-field first with all index files, and then run it again, using the "--verify" option, passing in the first-round WCS solution to verify, and using a single (probably small-scale) index file. That will re-fit the solution using that single index file.
cheers,
--dustin
--
You received this message because you are subscribed to the Google Groups "astrometry" group.
To unsubscribe from this group and stop receiving emails from it, send an email to astrometry+...@googlegroups.com.
To view this discussion on the web visit https://groups.google.com/d/msgid/astrometry/34c73bf5-948f-4360-9047-ace1c9327041n%40googlegroups.com.
Toni Šarić
Dec 20, 2021, 5:03:43 AM12/20/21
to astrometry
Hi.
@Bryan
RA/Dec does not change through the whole set of images, my star has fixed RA/Dec coordinates. Its pixel position changes when I convert that RA/Dec to pixels position in the image.
@Dustin
Regarding wave-like behavior: Yes, I am using solve-field directly on my images.
I agree that a good idea would be to solve-field first on all index files, and then run it again with verify but with only one index file to verify, but that solution includes manually rerunning astrometry, and I am aiming to solve images automatically(we talked already about making astrometry run verify automatically).
Then, looks like the best solution would be to use fixed index files, probably the one containing the most stars(ex. 4210 for my FoV).
However, my concern is, would astrometry be able to solve every image with it, and am I discarding possibly a better solution(with a different index file)?
BR
Toni
Dustin Lang
Dec 20, 2021, 9:24:11 AM12/20/21
to Toni Šarić, astrometry
It should be fairly easy to script up calling solve-field twice... something like
for x in myimages*.jpg; do
solve-field $x;
solve-field --verify $(echo $x | sed s/.jpg/.wcs/g) --config single-index-file.cfg $x;
done
To view this discussion on the web visit https://groups.google.com/d/msgid/astrometry/6286a66f-9792-48c4-86a3-8c4a51108b18n%40googlegroups.com.
Reply all
Reply to author
Forward
0 new messages