Some unity games stop profiling at startup, because perfetto::profiling::Client::RecordMalloc return false at PERFETTO_UNLIKELY(getpid() != pid_at_creation_

351 views
Skip to first unread message

Jimmy Yuan

unread,
Jan 7, 2020, 11:13:53 AM1/7/20
to android-platform
"Detected post-fork child situation, stopping profiling."
Can't handle this situation?
I comment the return code, everything going on.
Please fix this situation.
Thank you.

Florian Mayer

unread,
Jan 8, 2020, 12:05:14 PM1/8/20
to android-platform
Thanks for getting in touch. We do not support profiling across forks.

What you can do is start the profile only after the process has forked (we do support enabling profiling after a process has started – the resulting data will not include allocations that were made before the profile was started).

You can also profile the process from startup, then when you see the "Detected post-fork child situation, stopping profiling" message, start a second profile for the new process.

Hope this helps,
Florian

ลําใย พรมมีเดช

unread,
Jan 8, 2020, 12:05:14 PM1/8/20
to android-platform


เมื่อ วันอังคารที่ 7 มกราคม ค.ศ. 2020 23 นาฬิกา 13 นาที 53 วินาที UTC+7, Jimmy Yuan เขียนว่า:

Jimmy Yuan

unread,
Jan 9, 2020, 3:32:57 PM1/9/20
to android-platform
Thanks for you response. The problem is I don't known where is code fork called, maybe in some third party plugins. After fork the new process stoped soon(ps -A | grep new_pid got nothing). And the parent process(pid_at_creation_) is keep running, but the profd_client has called ShutdownLazy.

Florian Mayer

unread,
Jan 10, 2020, 10:15:45 AM1/10/20
to android-platform
This should not impact the parent process, we only stop the profiling session in the child. 

Are you not able to get the profile for the parent either? Could you provide more detailed information on what you are attempting to do, what you expect to happen and what happens instead?

Thank you,
Florian

Jimmy Yuan

unread,
Jan 13, 2020, 10:34:51 AM1/13/20
to android-platform
I want to make a tool sum a .so library's memory usage.

Here is my practice.

start.sh
adb shell am force-stop com.foo.bar
adb shell monkey -p com.foo.bar -c android.intent.category.LAUNCHER 1
adb shell perfetto -c - --txt --detach=session1 \
    -o /data/misc/perfetto-traces/trace \
<<EOF

buffers: {
    size_kb: 100352
    fill_policy: RING_BUFFER
}
buffers: {
    size_kb: 2048
    fill_policy: RING_BUFFER
}

data_sources: {
    config {
        name: "android.heapprofd"
        target_buffer: 0
        heapprofd_config {
            sampling_interval_bytes: 4096
            process_cmdline: "com.foo.bar"
            shmem_size_bytes: 67108864
        }
    }
}

flush_period_ms: 3000
write_into_file: true

EOF


stop.sh
adb shell perfetto --attach=session1 --stop

run start.sh
wait app start to login
run stop.sh

adb pull /data/misc/perfetto-traces/trace trace

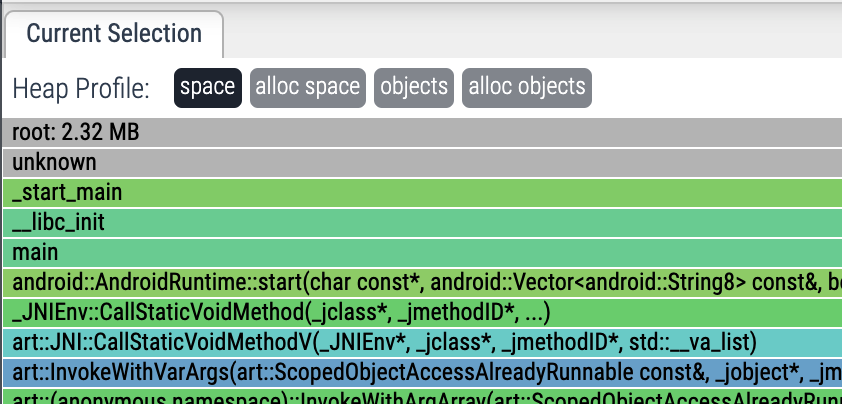
Open trace from Perfetto UI, Heap Profile only show one track point at start.
I find "Detected post-fork child situation, stopping profiling" from logcat.
I hack the return code to return true and replaced heapprofd_client.so I compiled.
Open trace from Perfetto UI, Heap Profile show track points as I wish.

Florian Mayer

unread,
Jan 14, 2020, 1:37:13 PM1/14/20
to android-platform
Hello!

The configuration shown should only produce a single dump, at the end of the session.

Also, could you try `perfetto -d` in start.sh, and just `adb shell killall -INT perfetto` in stop.sh?
The use of --attach is not encouraged: https://docs.perfetto.dev/#/detached-mode

> Open trace from Perfetto UI, Heap Profile show track points as I wish.
Can you elaborate what you mean by that? What exactly did you expect?

Cheers,
Florian
PS: As an side, you can remove the 2048 kB buffer, because it is unused in the config below.

Jimmy Yuan

unread,
Mar 6, 2020, 11:34:21 AM3/6/20
to android-platform
Hi, I'm back.
I tried `perfetto -d` and `adb shell killall -INT perfetto`.

03-06 14:48:55.406 12971 12971 W perfetto: type=1400 audit(0.0:740): avc: denied { getattr } for path="socket:[321589]" dev="sockfs" ino=321589 scontext=u:r:perfetto:s0 tcontext=u:r:adbd:s0 tclass=unix_stream_socket permissive=0

03-06 14:48:55.413 12981 12981 I perfetto: perfetto_cmd.cc:604 Connected to the Perfetto traced service, starting tracing for 0 ms

03-06 14:48:55.414   941   941 I perfetto: tracing_service_impl.cc:529 Configured tracing, #sources:1, duration:0 ms, #buffers:1, total buffer size:102400 KB, total sessions:1

03-06 14:48:56.088 13030 13030 I perfetto: heapprofd_producer.cc:181 Connected to the service, mode [child].

03-06 14:48:56.098 13008 13028 I perfetto: malloc_hooks.cc:406 heapprofd_client initialized.

03-06 14:49:01.724 13073 13064 I perfetto: client.cc:257 Detected post-fork child situation, stopping profiling.

03-06 14:50:13.603 12981 12981 I perfetto: perfetto_cmd.cc:815 SIGINT/SIGTERM received: disabling tracing.

03-06 14:50:13.701 12981 12981 I perfetto: perfetto_cmd.cc:677 Wrote 448780 bytes into /data/misc/perfetto-traces/trace

03-06 14:50:13.732   941   941 I perfetto: tracing_service_impl.cc:1660 Tracing session 5 ended, total sessions:0


trace.png


                   Pss  Private  Private  SwapPss     Heap     Heap     Heap

                 Total    Dirty    Clean    Dirty     Size    Alloc     Free

                ------   ------   ------   ------   ------   ------   ------

  Native Heap   288372   288328        0    13907   321040   309487    11552

  Dalvik Heap     5407     5336        0       96     5199     2600     2599

 Dalvik Other     1732     1728        0       20                           

        Stack       36       36        0       20                           

       Ashmem       12        0        0        0                           

      Gfx dev    49672    49672        0        0                           

    Other dev      161        8      148        0                           

     .so mmap    27031      920    24048      316                           

    .jar mmap     2218        0      152        0                           

    .apk mmap      681        0        8        0                           

    .dex mmap     3875     3628        4     3000                           

    .oat mmap      236        0      120        0                           

    .art mmap     5196     4280       64      700                           

   Other mmap      557      160       84        0                           

   EGL mtrack    78276    78276        0        0                           

    GL mtrack     5972     5972        0        0                           

      Unknown   114590   114552        0      781                           

        TOTAL   602864   552896    24628    18840   326239   312087    14151


 App Summary

                       Pss(KB)

                        ------

           Java Heap:     9680

         Native Heap:   288328

                Code:    28880

               Stack:       36

            Graphics:   133920

       Private Other:   116680

              System:    25340


               TOTAL:   602864       TOTAL SWAP PSS:    18840


I think the root should show 280MB, not 2.32MB in my mind.

Maybe the log can help.

03-06 14:49:01.724 13073 13064 I perfetto: client.cc:257 Detected post-fork child situation, stopping profiling.

trace

Florian Mayer

unread,
Mar 8, 2020, 4:52:10 PM3/8/20
to android-...@googlegroups.com
Thanks for getting in touch.

heapprofd will only show allocations made during the time it was running. Your log suggests that your profile was running for less than two seconds:

03-06 14:48:55.414   941   941 I perfetto: tracing_service_impl.cc:529 Configured tracing, #sources:1, duration:0 ms, #buffers:1, total buffer size:102400 KB, total sessions:1

[...]

03-06 14:50:13.603 12981 12981 I perfettoperfetto_cmd.cc:815 SIGINT/SIGTERM received: disabling tracing.


If you want to see all allocations, you have to start the profile before starting the app.

Hope that helps,
Florian

--
You received this message because you are subscribed to a topic in the Google Groups "android-platform" group.
To unsubscribe from this topic, visit https://groups.google.com/d/topic/android-platform/rAMUnoMfys8/unsubscribe.
To unsubscribe from this group and all its topics, send an email to android-platfo...@googlegroups.com.
To view this discussion on the web visit https://groups.google.com/d/msgid/android-platform/eec2d2ac-1756-438d-bacd-6052939e845d%40googlegroups.com.

Jimmy Yuan

unread,
Mar 9, 2020, 11:05:59 AM3/9/20
to android-platform
I think it's two minutes.
I did start the profile before starting the app.
I think this log showed stopping profiling the app.
03-06 14:49:01.724 13073 13064 I perfetto: client.cc:257 Detected post-fork child situation, stopping profiling.

To unsubscribe from this group and all its topics, send an email to android-...@googlegroups.com.

Jimmy Yuan

unread,
Mar 19, 2020, 12:08:14 PM3/19/20
to android-platform
Hello, you can add this function to a demo.

public static void test() {
    Runtime.getRuntime().exec("ls -l /data/local/tmp");
}

After call the test function, the malloc data can't be record.
To unsubscribe from this group and all its topics, send an email to android-...@googlegroups.com.

Jimmy Yuan

unread,
Mar 20, 2020, 11:50:59 AM3/20/20
to android-platform
I found a solution.
Check the getpid() != pid_at_creation_ at beginning of RecordMalloc and RecordFree.
Return true if check result is true.
Just ignore malloc hooks in child process.
To unsubscribe from this group and all its topics, send an email to android-...@googlegroups.com.

fma...@google.com

unread,
Apr 16, 2020, 6:24:11 PM4/16/20
to android-platform
Hey! I have looked into this more. Can you check if applying this CL fixes it for you?
Reply all
Reply to author
Forward
0 new messages