network visualization question
33 views
Skip to first unread message

acu...@gmail.com
Jul 21, 2021, 12:29:17 PM7/21/21
to ORA Google Group
Hi,
I have a dataset in ORA-LITE that consists of individual ego networks. I have each one loaded as a separate metanetwork in ORA. I want to visualize each network and use the same color scheme to code the nodes based on an attribute. The attribute variable is the same in each ego network, and denotes the alter's relationship to the ego (whether they are an immediate family member, extended family member, from school, or from community). Each time I try to use the node appearance --> node color --> color node by attribute or measures, ORA uses a different color scheme to denote the 4 categories (e.g, for Ego network #1, yellow==school, but for ego network #2 yellow=immediate family). Is there a way to set a default color scheme that I can then reuse as I visualize all of the ego networks? if not, how do I manually set these? Also, the transparency seems to vary from one visualization to the next. Is there a way to reset this to 0% transparency for all of the visualizations? Finally, how can I create a legend that shows which color denotes which type of connection?
Thanks so much,
Alison

Jon Storrick
Jul 21, 2021, 2:06:21 PM7/21/21
to ORA-goog...@googlegroups.com
Also, the transparency seems to vary from one visualization to the next. Is there a way to reset this to 0% transparency for all of the visualizations?
Are you manipulating the transparency at all? There shouldn't be anything going on with the transparency under normal circumstances.
ORA uses a different color scheme to denote the 4 categories (e.g, for Ego network #1, yellow==school, but for ego network #2 yellow=immediate family)
That is likely caused by different meta-networks having different numbers of attribute values. The visualizer tries to generate notably different colors for the attribute values it has at the moment. When values aren't present in one meta-network vs another, the visualizer just thinks it has fewer values and thus increases the hue difference between colors.
Is there a way to set a default color scheme that I can then reuse as I visualize all of the ego networks? if not, how do I manually set these..... Finally, how can I create a legend that shows which color denotes which type of connection?
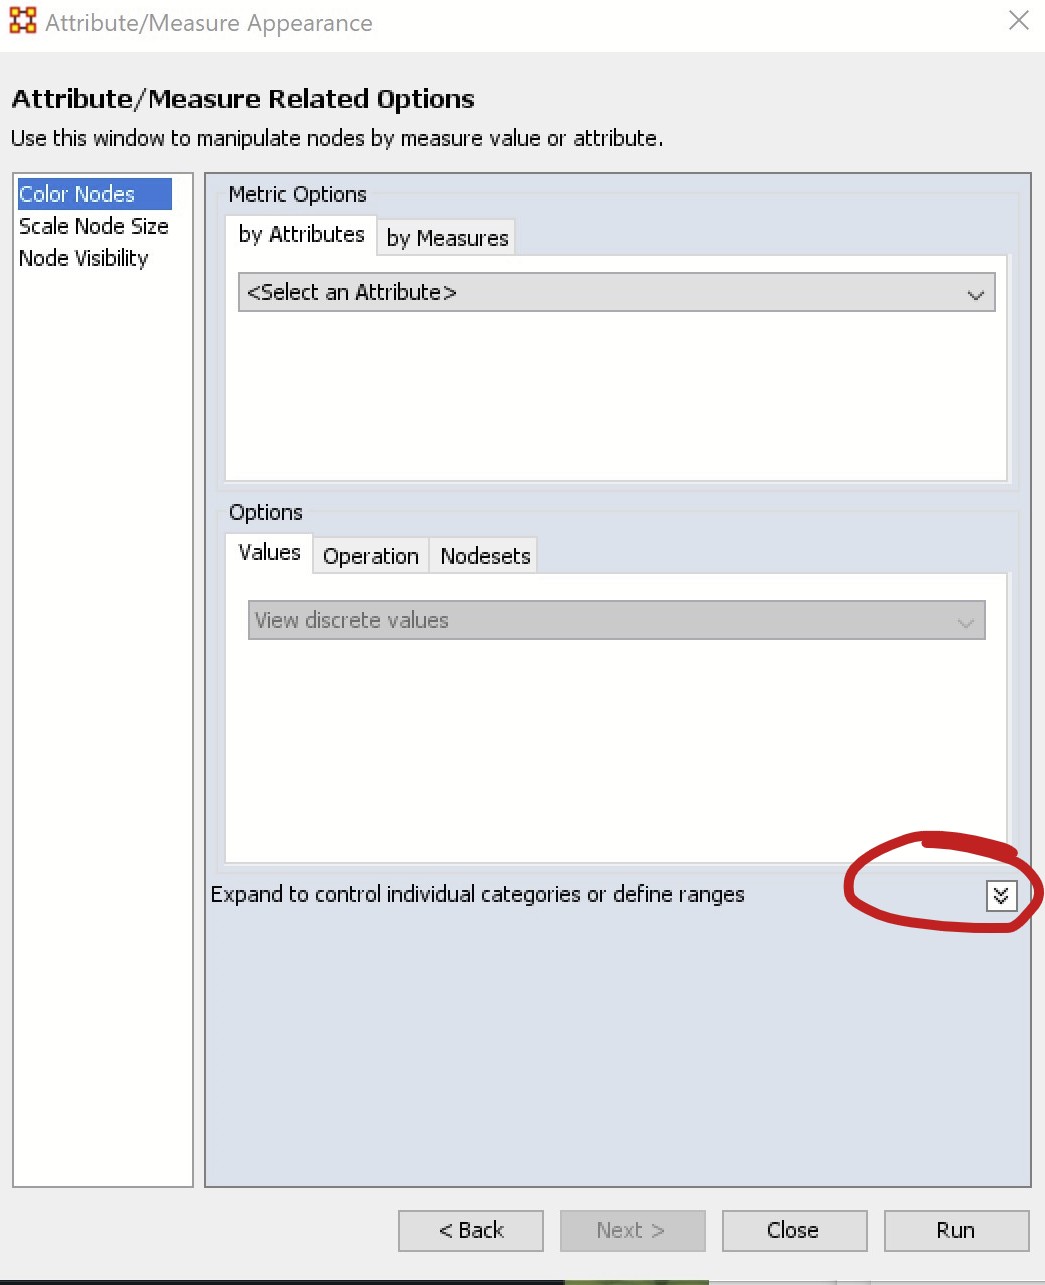
First I'd like to introduce you to a different dialog. At the bottom of the Node Appearance menu there's an item called "Change Appearance Using Node Metrics" or "Advanced Attribute/Measure Related Options," depending on your version. For attributes, we can safely click on "next" on the bottom of the screen to get past the first page. On the second page, make sure "Color Nodes" is selected in the left column and that the "by attributes" tab is selected just to the right of that (they should be selected by default). This works much the same way as the dialog you did the initial workin, with a few more features under the hood. Specify an attribute, click the "Run" button on the bottom right of the dialog, and everything should change.
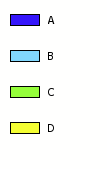
Most notably, a legend should also pop-up, indicating which color connects to which attribute value.

If, for any reason, you want to adjust the color mapping, you can click the double-down arrows to expand the dialog (see screenshot at bottom of email). It will list every value and the color that it maps to. To change the color, simply click on it and select a new one. You'll have to click on "run" again to get the visualizer to update the changes.
Now then, as for the question of "is there an easy way to replicate these colorings over multiple meta-networks?" The answer is yes, as long as the relevant attribute values are the EXACT same across different networks.
Start by visualizing a meta-network with all of the attribute values you want to have colors for - create a temporary meta-network with every value if necessary. Do the steps mentioned here to apply a coloring. Copy the legend to powerpoint or wherever.
Now, for the important part - click on "View -> Save Visualizer Profile". That will save an xml document containing a record of the coloring operation you just did. All the values, what color they mapped to, etc. For the other meta-networks, you can use "View -> Load Visualizer Profile" to use that profile XML to apply the same color mapping to the new dataset. It won't infer new colors for attribute values that weren't present in the first run, so you may get some grays in the display if the attribute values aren't 100% exact.
--
Computational Analysis of Social and Organizational Systems (CASOS)
The Institute for Software Research, Department of Computer Science
Carnegie Mellon University, Pittsburgh, PA, USA
http://casos.cs.cmu.edu/
---
You received this message because you are subscribed to the Google Groups "ORA Google Group" group.
To unsubscribe from this group and stop receiving emails from it, send an email to ORA-google-gro...@googlegroups.com.
To view this discussion on the web visit https://groups.google.com/d/msgid/ORA-google-group/a986becb-79d0-4ca6-ad60-e01ed954c4a5n%40googlegroups.com.
--
Jon Storrick | jon.storrick (at) gmail.com

Kathleen Carley
Jul 21, 2021, 2:36:27 PM7/21/21
to ORA List
On Wed, Jul 21, 2021 at 2:06 PM Jon Storrick <jon.st...@gmail.com> wrote:
Also, the transparency seems to vary from one visualization to the next. Is there a way to reset this to 0% transparency for all of the visualizations?Are you manipulating the transparency at all? There shouldn't be anything going on with the transparency under normal circumstances.
no - but it might be the difference between saving as a png or just snipping it from the desk top (this is not something to waste time on :) )
ORA uses a different color scheme to denote the 4 categories (e.g, for Ego network #1, yellow==school, but for ego network #2 yellow=immediate family)That is likely caused by different meta-networks having different numbers of attribute values. The visualizer tries to generate notably different colors for the attribute values it has at the moment. When values aren't present in one meta-network vs another, the visualizer just thinks it has fewer values and thus increases the hue difference between colors.
is there a way of telling it to use a set of x values?
Is there a way to set a default color scheme that I can then reuse as I visualize all of the ego networks? if not, how do I manually set these..... Finally, how can I create a legend that shows which color denotes which type of connection?First I'd like to introduce you to a different dialog. At the bottom of the Node Appearance menu there's an item called "Change Appearance Using Node Metrics" or "Advanced Attribute/Measure Related Options," depending on your version. For attributes, we can safely click on "next" on the bottom of the screen to get past the first page. On the second page, make sure "Color Nodes" is selected in the left column and that the "by attributes" tab is selected just to the right of that (they should be selected by default). This works much the same way as the dialog you did the initial workin, with a few more features under the hood. Specify an attribute, click the "Run" button on the bottom right of the dialog, and everything should change.Most notably, a legend should also pop-up, indicating which color connects to which attribute value.If, for any reason, you want to adjust the color mapping, you can click the double-down arrows to expand the dialog (see screenshot at bottom of email). It will list every value and the color that it maps to. To change the color, simply click on it and select a new one. You'll have to click on "run" again to get the visualizer to update the changes.Now then, as for the question of "is there an easy way to replicate these colorings over multiple meta-networks?" The answer is yes, as long as the relevant attribute values are the EXACT same across different networks.Start by visualizing a meta-network with all of the attribute values you want to have colors for - create a temporary meta-network with every value if necessary. Do the steps mentioned here to apply a coloring. Copy the legend to powerpoint or wherever.Now, for the important part - click on "View -> Save Visualizer Profile". That will save an xml document containing a record of the coloring operation you just did. All the values, what color they mapped to, etc. For the other meta-networks, you can use "View -> Load Visualizer Profile" to use that profile XML to apply the same color mapping to the new dataset. It won't infer new colors for attribute values that weren't present in the first run, so you may get some grays in the display if the attribute values aren't 100% exact.

OK THIS IS AWESOME --- I think this solves most issues
Hi,I have a dataset in ORA-LITE that consists of individual ego networks. I have each one loaded as a separate metanetwork in ORA. I want to visualize each network and use the same color scheme to code the nodes based on an attribute. The attribute variable is the same in each ego network, and denotes the alter's relationship to the ego (whether they are an immediate family member, extended family member, from school, or from community). Each time I try to use the node appearance --> node color --> color node by attribute or measures, ORA uses a different color scheme to denote the 4 categories (e.g, for Ego network #1, yellow==school, but for ego network #2 yellow=immediate family). Is there a way to set a default color scheme that I can then reuse as I visualize all of the ego networks? if not, how do I manually set these? Also, the transparency seems to vary from one visualization to the next. Is there a way to reset this to 0% transparency for all of the visualizations? Finally, how can I create a legend that shows which color denotes which type of connection?Thanks so much,Alison--
Computational Analysis of Social and Organizational Systems (CASOS)
The Institute for Software Research, Department of Computer Science
Carnegie Mellon University, Pittsburgh, PA, USA
http://casos.cs.cmu.edu/
---
You received this message because you are subscribed to the Google Groups "ORA Google Group" group.
To unsubscribe from this group and stop receiving emails from it, send an email to ORA-google-gro...@googlegroups.com.
To view this discussion on the web visit https://groups.google.com/d/msgid/ORA-google-group/a986becb-79d0-4ca6-ad60-e01ed954c4a5n%40googlegroups.com.
--Jon Storrick | jon.storrick (at) gmail.com--
Computational Analysis of Social and Organizational Systems (CASOS)
The Institute for Software Research, Department of Computer Science
Carnegie Mellon University, Pittsburgh, PA, USA
http://casos.cs.cmu.edu/
---
You received this message because you are subscribed to the Google Groups "ORA Google Group" group.
To unsubscribe from this group and stop receiving emails from it, send an email to ORA-google-gro...@googlegroups.com.
To view this discussion on the web visit https://groups.google.com/d/msgid/ORA-google-group/CADDSmL7s5huJj-n-F9FouO096e6qgJaqB064YdZ3wPA%2BVVkxig%40mail.gmail.com.
acu...@gmail.com
Jul 21, 2021, 4:24:11 PM7/21/21
to ORA Google Group
Thank you so much. This is incredibly helpful. I was able to edit the color scheme and save it as an xml file using the instructions provided. When I open another meta network and go to view --> load visualizer profile, nothing seems to happen. I tried doing that as a first step. Then, when I use the "attribute/measure related options" and select color by node, it uses a different color scheme despite the values being identical for the variable selected in both meta networks. How do I get the new meta network to recognize the visualizer profile I loaded? Should something happen when I load it that will help me confirm it is properly loading? Do I need to do these steps in a different order?
Many thanks for your help,
Alison
Reply all
Reply to author
Forward
0 new messages