geospatial visualization- US cbsa
93 views
Skip to first unread message

jiali...@gmail.com
Oct 11, 2021, 3:12:23 PM10/11/21
to ORA Google Group
Hello,
I have some US cbsa migration data which I would like to visualize in my ORA-2019. I have loaded the network (as in the attached screenshots) and I have downloaded the cbsa shapefile from data.gov. I don't know where to proceed; it has been a while since I attended the 2018 summer camp. Could you kindly help me?
The node name is the five-digit cbsa fips code, as shown in the first screenshot. The shapefile contains this code and latitude and longitude, as shown in the second screenshot. The third screenshot is the visualization without the geospatial map.
Thanks,
Jialin

Jon Storrick
Oct 11, 2021, 5:01:39 PM10/11/21
to ORA-goog...@googlegroups.com
Hi Jialin,
I believe I can walk you through how to solve this. I'll start it from where you are in Screenshot 1 - you have a meta-network with two nodesets of interest.
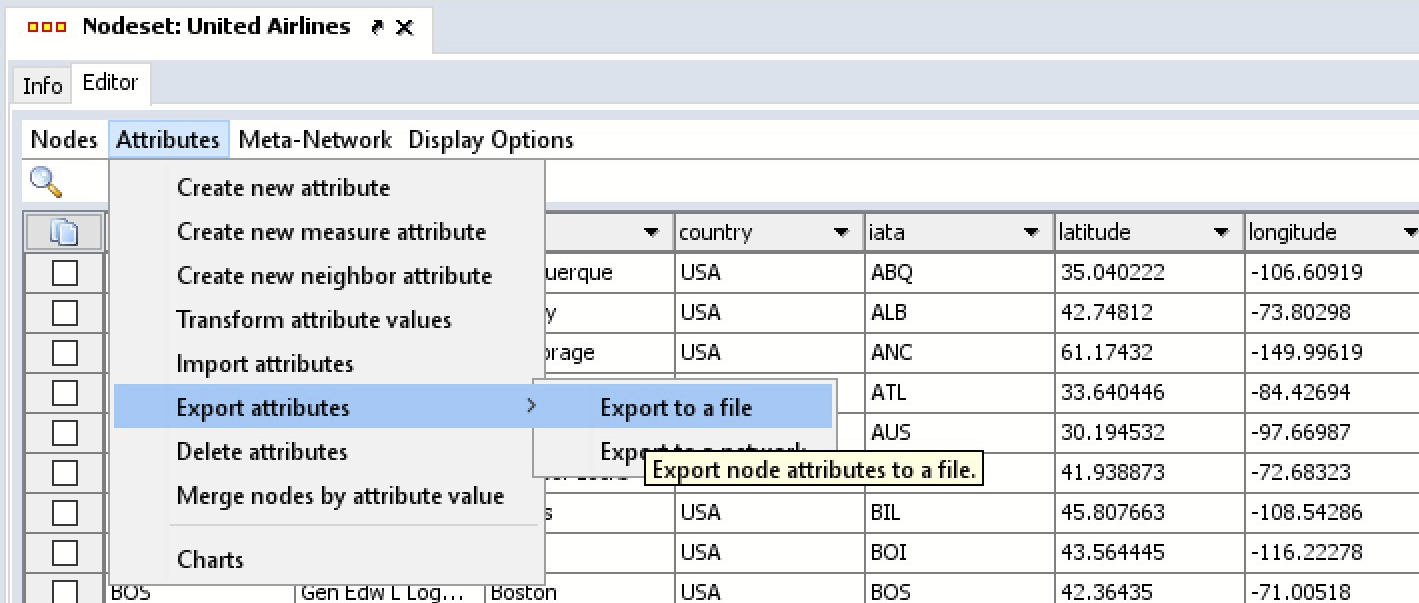
Step 1) Export Attributes
In the Nodeset Editor (which you're viewing in screenshot 1) for the shapefile, TL_2019_us_cbsa. Select Attributes -> Export Attributes -> Export to a File. The dialog that pops up is pretty straightfoward. Specify a location to save this attributes file, and make sure you export the CBSAFP, the Latitude, and Longitude attributes.
This will give us a mapping of Zip to Lat/Lon.
Step 2) Import Attributes
In the Nodeset Editor for your data, select "Attributes- > Import Attributes."

Once you specify the file, it'll auto-populate with all of your options. The most important bits - in Step 2, specify that you want to match Node ID with column
CBSAF. In step 3, make sure you select Latitude and Longitude as values to import.
When importing as Latitude and Longitude, GIS isn't case sensitive, but it will specifically look for the words "latitude" and "longitude". You should also specify the Type as "Number", if it isn't already set as such. I can see in screenshot 1 that Latitude is currently a Text/Text Category, as numerical attributes won't let you have + signs.
Step 3) Delete the
TL_2019_us_cbsa nodeset. You shouldn't need it anymore.
Step 4) Start up GIS.
In the main ORA Interface, it's under the menu "Visualizations -> Geospatial Networks." If your Location nodeset has the type Location and has "latitude" and "longitude" coordinates, starting up GIS should go without issue.
--
Computational Analysis of Social and Organizational Systems (CASOS)
The Institute for Software Research, Department of Computer Science
Carnegie Mellon University, Pittsburgh, PA, USA
http://casos.cs.cmu.edu/
---
You received this message because you are subscribed to the Google Groups "ORA Google Group" group.
To unsubscribe from this group and stop receiving emails from it, send an email to ORA-google-gro...@googlegroups.com.
To view this discussion on the web visit https://groups.google.com/d/msgid/ORA-google-group/43c4df3e-0d5f-461f-b157-b69d949fe891n%40googlegroups.com.
--
Jon Storrick | jon.storrick (at) gmail.com
jiali...@gmail.com
Oct 11, 2021, 8:22:49 PM10/11/21
to ORA Google Group
Thank you, this is very helpful. I have my visualization now (as shown below). The links represent US migration since 2008 as reflected by consumer credit reports. I have two more questions: a) is there a 'Map Option' with only US state boundary, the 'cleanest' version? and (b) The network was directed (columns are out-flowing cities, and rows are inflows; the matrix wasn't symmetric), how do I add arrows to represent these flows?

Jialin
Jon Storrick
Oct 12, 2021, 4:30:52 PM10/12/21
to ORA-goog...@googlegroups.com
To turn arrows on and off, you want to click the green button in the toolbar. It has a white inset, with a line with arrows on each end.
You can switch to a cleaner, just US background by selecting navigating to "Options -> Use 2D Visualization (Openmap)" in the menus. You may have to switch some networks on/off in the layer manager to force it to update the link renderers.
-Jon
To view this discussion on the web visit https://groups.google.com/d/msgid/ORA-google-group/c56ce5d1-b5df-4f2d-ab13-e9697fbb3d92n%40googlegroups.com.
jiali...@gmail.com
Oct 12, 2021, 5:00:04 PM10/12/21
to ORA Google Group
Thank you. I found the clean map option. But I didn't explain it clearly on the arrows. Is it possible for me to have one-direction arrows, pointing from column nodes to row nodes?
Jialin
Jon Storrick
Oct 12, 2021, 5:28:24 PM10/12/21
to ORA-goog...@googlegroups.com
GIS should only create arrows in both directions if links exist going both ways. If each link has arrows going in both directions, your data likely has links going in both directions. You might want to look through your data, look for links that are contributing to the bidirectional movement, and trim some links with low values (indicating low migration)?


To view this discussion on the web visit https://groups.google.com/d/msgid/ORA-google-group/07ef7693-7a6c-40b8-883c-aca4d23e6789n%40googlegroups.com.
Jialin Hou
Oct 12, 2021, 7:42:54 PM10/12/21
to ORA-goog...@googlegroups.com
You were right. Sorry I didn't look closely (those one-way flows were, of course, with a much smaller volume than two-ways, but I already chose to hide small links). This is what I will keep as a start point for my new paper (in economics). Deeper colored states are those with the most inter-state migration after 2008 reflected by some major consumer credit bereau.

Thank you so much for the help.
Jialin
You received this message because you are subscribed to a topic in the Google Groups "ORA Google Group" group.
To unsubscribe from this topic, visit https://groups.google.com/d/topic/ORA-google-group/AR1YHoRM1vk/unsubscribe.
To unsubscribe from this group and all its topics, send an email to ORA-google-gro...@googlegroups.com.
To view this discussion on the web visit https://groups.google.com/d/msgid/ORA-google-group/CADDSmL4MFrAhoVFbx_tRgxZ8SESB3vOQPzTEUK949v91rv2WqA%40mail.gmail.com.
Reply all
Reply to author
Forward
0 new messages