Burn Up Charts

christin...@usbank.com

Jerry Odenwelder
If you have the VersionOne Ultimate Edition, there is also the Agile Earned Value report and the Epic Burn-up charts. Both are available on any Dashboard.

From: Jeremy Keeler [mailto:jke...@seisware.com]
Sent: Wednesday, March 04, 2015 3:09 PM
To: versiono...@googlegroups.com
Cc: david.s...@usbank.com; stacie...@usbank.com; shahid...@usbank.com
Subject: RE: Burn Up Charts
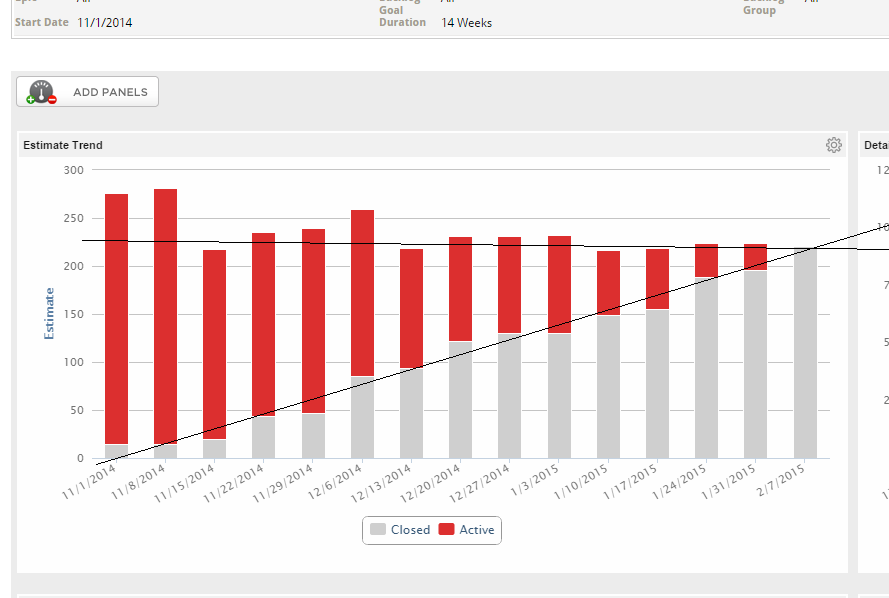
I like using the estimation trend for this.
I like this because you this is a much better way to find out a projects end date. You can see that it is really is the intersection of these two lines that will give you an appropriate end date. Project burn down reports assume there will be no stories added at that point which of course we know is not true.
This is an example below of one of our milestones. You can see that we have too much to start, removed stories, story crept for 4 weeks, remove more and near the end of the milestone we start getting more stable.
Great chart and I love it.
PS. I just drew those black lines on there lol.
Jeremy
--
You received this message because you are subscribed to the Google Groups "VersionOne-users" group.
To unsubscribe from this group and stop receiving emails from it, send an email to
versionone-use...@googlegroups.com.
To post to this group, send email to
versiono...@googlegroups.com.
Visit this group at http://groups.google.com/group/versionone-users.
For more options, visit https://groups.google.com/d/optout.

Dan Tanner
Jeff Cox
Check out the Estimate Trend report, in the Project/Release Reports.
From: versiono...@googlegroups.com [mailto:versiono...@googlegroups.com] On Behalf Of Dan Tanner
Sent: Monday, April 13, 2015 12:20 PM
To: versiono...@googlegroups.com
Cc: david.s...@usbank.com; stacie...@usbank.com; shahid...@usbank.com
--
Sean McCrohan
The Project Scorecard, coming in release 15.2 next week, includes a project burn-up chart.
From: versiono...@googlegroups.com [mailto:versiono...@googlegroups.com]
On Behalf Of Dan Tanner
Sent: Monday, April 13, 2015 12:20 PM
To: versiono...@googlegroups.com
Cc: david.s...@usbank.com; stacie...@usbank.com; shahid...@usbank.com
Subject: Re: Burn Up Charts
They have recently updated the appearance of many of the base charts. If you go to the Sprint Burndown report, it'll include a Burn-up chart by default among the others provided. This can be generated per team or overall. I'm not sure if this is available by itself in a bigger chart or not.
On Wednesday, March 4, 2015 at 11:46:36 AM UTC-6,
christin...@usbank.com wrote:
It has been recommended that we use a Burn-Up chart on our projects. Does anyone know how to get this type of chart in Version One?
--