Question about Wiener Diffusion Model Distribution in rstan_2.7.0-2

Andrew Ellis
library(rstan)
library(RWiener)


# generate data using RWiener package
set.seed(0)
dat <- rwiener(n = 1000, alpha = 1, tau = 0.2, beta = 0.5, delta = 0.5)

standata <- list(y = ifelse(dat$resp == "upper", dat$q, -1 * dat$q),
                 N = length(dat$resp))


wiener_model <- "
data {
    int<lower=0> N;
    real y[N];
}
parameters {
    real<lower=0> a;
    real<lower=0> t;
    real<lower=0,upper=1> b;
    real v;
}
model {
    v ~ normal(0, 2);


    for (n in 1:N) {
        y[n] ~ wiener(1, 0.2, 0.5, v);
    }
}"


fit <- stan(model_code = wiener_model, data = standata)
Rejecting initial value:
  Error evaluating the log probability at the initial value.


Informational Message: The current Metropolis proposal is about to be rejected because of the following issue:
Exception thrown at line 16:
stan::math::wiener_log(%1%): Random variable is -0.395369, but must be > 0!
If this warning occurs sporadically, such as for highly constrained variable types like covariance matrices, then the sampler is fine,
but if this warning occurs often then your model may be either severely ill-conditioned or misspecified.
> sessionInfo()
R version 3.2.1 (2015-06-18)
Platform: x86_64-apple-darwin13.4.0 (64-bit)
Running under: OS X 10.10.4 (Yosemite)


locale:
[1] en_GB.UTF-8/en_GB.UTF-8/en_GB.UTF-8/C/en_GB.UTF-8/en_GB.UTF-8


attached base packages:
[1] stats     graphics  grDevices utils     datasets  methods   base


other attached packages:
[1] RWiener_1.2-0  rstan_2.7.0-2  Rcpp_0.12.0    magrittr_1.5   devtools_1.8.0


loaded via a namespace (and not attached):
 [1] codetools_0.2-14   digest_0.6.8       R6_2.1.0           stats4_3.2.1       git2r_0.10.1       httr_1.0.0
 [7] stringi_0.5-5      curl_0.9.1         xml2_0.1.1         tools_3.2.1        stringr_1.0.0.9000 inline_0.3.14
[13] rversions_1.0.2    memoise_0.2.1
Andrew Ellis
set.seed(0)
dat <- rwiener(n = 5000, alpha = 1, tau = 0.2, beta = 0.75, delta = 0.5)
standata <- list(y = dat$q,
                 resp = ifelse(dat$resp == "upper", 1, 0),
                 N = length(dat$resp))
and in the stan model, y ~ wiener(a, t, b, v) if the "upper" response was selected, and y ~ wiener(a, t, 1-b, -v) if the "lower" response was selected.
data {
  int<lower=0> N;
  real y[N];
int<lower=0, upper=1> resp[N];
}
parameters {
  real<lower=0> a;
  real<lower=0> t;
real<lower=0, upper=1> b;
  real v;
}
model {
  v ~ normal(0, 2);
  a ~ gamma(3, 3);
  t ~ gamma(4, 10);
  b ~ beta(5, 5);
for (n in 1:N) {
      if (resp[n] == 1) {
          y[n] ~ wiener(a, t, b, v);
      }
      else {
          y[n] ~ wiener(a, t, 1-b, -v);
      }


  }
}
library(rstan)
library(RWiener)


set.seed(0)
dat <- rwiener(n = 5000, alpha = 1, tau = 0.2, beta = 0.75, delta = 0.5)

## stan model ----
wiener_model <- "
data {
    int<lower=0> N;
    real y[N];
int<lower=0, upper=1> resp[N];
}
parameters {
    real<lower=0> a;
    real<lower=0> t;
real<lower=0, upper=1> b;
    real v;
}
model {
    v ~ normal(0, 2);
    a ~ gamma(3, 3);
    t ~ gamma(4, 10);
    b ~ beta(5, 5);
for (n in 1:N) {
        if (resp[n] == 1) {
            y[n] ~ wiener(a, t, b, v);
        }
        else {
            y[n] ~ wiener(a, t, 1-b, -v);
        }


    }
}"


## stan data ----
standata <- list(y = dat$q,
                 resp = ifelse(dat$resp == "upper", 1, 0),
                 N = length(dat$resp))
fit <- stan(model_code = wiener_model, data = standata)

Bob Carpenter
question from looking at it. I'm going to add an issue.
https://github.com/stan-dev/stan/issues/1576
Thanks for bringing it up. We'll cite you in the manual for
the great comments when we update our reference manual entry and
hopefully provide an example. Do you mind if we use yours if
we cite it? It all gets released under BSD for code and CC-BY
for text.
- Bob

Marco Inacio
wiener_log.hpp file which wrongly describes the possibility of lower
boundary by negating y (random variable) which was originally what the
patch of Joachim Vandekerckhove did.
I changed this (thus forcing y to be strictly positive) because there
was no computational advantage in doing so and thought it would be
potentially dangerous for users. I realize I should have discussed such
change with stan-dev at the time.
The Stan manual, however, correctly describes the current behavior
(although it does deserves a better explanation), and I didn't put it
there that y must positive because it is already in the category
"Non-negative Continuous Distributions".
Bob Carpenter
> On Aug 1, 2015, at 12:17 AM, Marco Inacio <marcoig...@gmail.com> wrote:
>
> I think the problem here was that Andrew looked at the documentation in wiener_log.hpp file which wrongly describes the possibility of lower boundary by negating y (random variable) which was originally what the patch of Joachim Vandekerckhove did.
>
> I changed this (thus forcing y to be strictly positive) because there was no computational advantage in doing so and thought it would be potentially dangerous for users. I realize I should have discussed such change with stan-dev at the time.
>
> The Stan manual, however, correctly describes the current behavior (although it does deserves a better explanation), and I didn't put it there that y must positive because it is already in the category "Non-negative Continuous Distributions".
which clearly indicates both the support for the outcome and any
constraints on parameters. Would you mind adding that? I'm still not
sure exactly what the behavior is, or I'd do it myself. I have no
idea what this density does!
- Bob
Marco Inacio
> I'd prefer to follow the pattern in the other distribution doc
> which clearly indicates both the support for the outcome and any
> constraints on parameters. Would you mind adding that?
Andrew Ellis
Andrew Ellis
On Saturday, August 1, 2015 at 6:17:52 AM UTC+2, Marco Inacio wrote:
I think the problem here was that Andrew looked at the documentation in
wiener_log.hpp file which wrongly describes the possibility of lower
boundary by negating y (random variable) which was originally what the
patch of Joachim Vandekerckhove did.
I changed this (thus forcing y to be strictly positive) because there
was no computational advantage in doing so and thought it would be
potentially dangerous for users. I realize I should have discussed such
change with stan-dev at the time.
The Stan manual, however, correctly describes the current behavior
(although it does deserves a better explanation), and I didn't put it
there that y must positive because it is already in the category
"Non-negative Continuous Distributions".

Matt
On Saturday, 1 August 2015 00:17:52 UTC-4, Marco Inacio wrote:
I changed this (thus forcing y to be strictly positive) because there
was no computational advantage in doing so and thought it would be
potentially dangerous for users.
I'm curious as to the potential dangers of not having y as strictly positive for the Wiener distribution?
Matt
Bob Carpenter
no definition in the manual. Is it symmetric around 0?
If so, I don't see any reason to constrain it to be positive.
You might want to do so in a model to avoid multimodality if
+theta and -theta have the same density.
- Bob

Mike Lawrence
Marco Inacio
If you check the implementation of this distribution in R (same author as this one), the function has an argument resp = "upper"/"lower"/"both", even though, internally the function uses negative/positive responses.
So I think that's the correct way of doing it, and in the future an extra argument for lower/upper/both responses can be added (with default to "upper"), but then this wouldn't be backward compatible if the function was accepting negative responses right now.
--
You received this message because you are subscribed to the Google Groups "Stan users mailing list" group.
To unsubscribe from this group and stop receiving emails from it, send an email to stan-users+...@googlegroups.com.
For more options, visit https://groups.google.com/d/optout.
Mike Lawrence
Elaborations of this model have been used extensively in the study of speeded human decisions (ex. simple perceptual decisions like "is this square black or white?" or more abstract decisions like "is this word English or French?") since the 1970s to connect the observed data of response speed and response accuracy to latent variables that can be more informative on the structure of the mind. For example, a given experimental manipulation might yield fast-but-error-prone responses in one condition and slow-but-accurate responses in another. The manipulation obviously causes a trade-off of speed and accuracy, but is there any additional changes to information processing as well? Where the diffusion model explicitly operationalizes information processing efficiency (bias of the walker; more biased=faster information processing) as independent of the speed-accuracy trade-off criterion (separation of the bounds; closer bounds = more emphasis on speed, less on accuracy), one can answer this question. Other parameters of the more elaborated models can address other interesting questions and there are also several competing models (ex. linear ballistic accumulator, log-normal race, etc) that generally seek to address similar questions. I'll actually be coding up an example of both the diffusion and log-normal race (which is easy with the distributions already in stan) in the next few days, and I'll post it to the examples for anyone interested.
Bob Carpenter
> On Aug 4, 2015, at 11:34 AM, Marco Inacio <marcoig...@gmail.com> wrote:
>
> Suppose for example the user does some manipulation in his/her data that should be strictly positive, but something goes wrong, and it gets negative, then the distribution should give him an error since negative time does not indeed exist.
are reversible. That's how we use negative time in NUTS, for
example.
> If you check the implementation of this distribution in R (same author as this one), the function has an argument resp = "upper"/"lower"/"both", even though, internally the function uses negative/positive responses.
for the doc.
Just to state the obvious, if there are constraints on variables,
either outcomes or parameters, then they should be checked.
> So I think that's the correct way of doing it, and in the future an extra argument for lower/upper/both responses can be added (with default to "upper"), but then this wouldn't be backward compatible if the function was accepting negative responses right now.
a new function.
- Bob
Marco Inacio
>> If you check the implementation of this distribution in R (same author as this one), the function has an argument resp = "upper"/"lower"/"both", even though, internally the function uses negative/positive responses.
> I'm still confused about the function, so I'll have to wait
> for the doc.
>
> Just to state the obvious, if there are constraints on variables,
> either outcomes or parameters, then they should be checked.
density) of the an specific process reach an upper boundary (alpha) or a
lower boundary (zero) (or both) in an specific time (time is the
response variable).
Examples:
> require(RWiener)
> # Probability of reaching the upper boundary alpha=2 in at most 100
units of time
> pwiener(100, alpha=2,tau=0.3, beta=0.45, delta=.4, "upper")
[1] 0.6430842
> # Probability of reaching the lower boundary 0 in at most 100 units
of time
> pwiener(100, alpha=2,tau=0.3,beta=0.45,delta=.4, "lower")
[1] 0.3569158
> # Probability of reaching any of the two boundaries in at most 100
units of time
> pwiener(100, alpha=2,tau=0.3,beta=0.45,delta=.4, "both")
[1] 1
(100 is so large for this values of the parameters that the pdf is
integrating to 1 already)
We are discussing which is the best way to select "upper"/"lower"/"both"
in Stan. I think the best way is to have an extra argument at the end
wiener_log just like the R examples above, but the author originally had
negative response variable meaning "lower", positive response variables
meaning "upper" (although the response variable of the process is in
fact time elapsed, so it's strictly positive)

Guido Biele
Bob Carpenter
crossing time are a good model of trading speed for accuracy.
If you create the models and simulate data (or even better have
a program you can share in Python or R to generate data),
we can put them in stan-dev/example-models if you're willing
to release them under BSD.
Are there plots of what the Wiener density looks like for various
parameters somewhere? I suppose I could make them with Stan now.
- Bob
Bob Carpenter
> On Aug 4, 2015, at 1:59 PM, Guido Biele <guido...@gmail.com> wrote:
>
> For what it's worth I believe the current implementation of the wiener is fine.
> Of course, a short example in the documentation that explains how the parameters are associated with different aspects of decision making would be helpful.
> (I can help with that if needed.)
requests have already done that.
> I think more interesting than having a wiener function that allows to specify if the likelihood for the lower or upper boundary should be returned would be to see if the current implementation can be made faster as described here: http://cvc.psy.ku.dk/gondan-2014.pdf.
sacrifice accuracy, if I can be self-referential to Mike
Lawrence's application). It's always easier to optimize
once there's a working version with tests in place.
I don't know if any of the Stan developers will have time to
do this, but we do take pull requests!
- Bob
Marco Inacio
On 2015-08-04 11:25 PM, Bob Carpenter wrote:
>> On Aug 4, 2015, at 1:59 PM, Guido Biele <guido...@gmail.com> wrote:
>>
>> For what it's worth I believe the current implementation of the wiener is fine.
>> Of course, a short example in the documentation that explains how the parameters are associated with different aspects of decision making would be helpful.
>> (I can help with that if needed.)
> Thanks, but I'm pretty sure Marco's most recent pull
> requests have already done that.
used this model, so help would be appreciated indeed.

Joachim Vandekerckhove
Bob Carpenter
manual issue comment for it:
https://github.com/stan-dev/stan/issues/1617#issuecomment-144792409
- Bob

Royce Anders
Mike Lawrence
Royce Anders
--
You received this message because you are subscribed to a topic in the Google Groups "Stan users mailing list" group.
To unsubscribe from this topic, visit https://groups.google.com/d/topic/stan-users/-6wJfA-t2cQ/unsubscribe.
To unsubscribe from this group and all its topics, send an email to stan-users+...@googlegroups.com.

Maciej Swat
Hi all
I have a related comment.
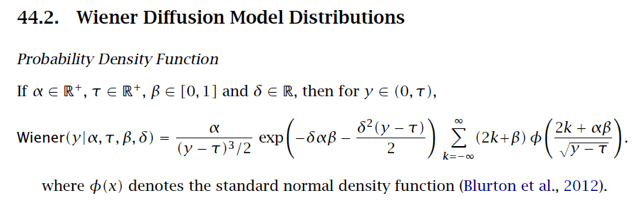
There are three potential typos in the STAN manual (2.9.0) in the
PDF for 'Wiener Diffusion Model Distributions’, but I’m not sure if these
bugs 2&3 proliferated into the code.
1. y is defined as 'y \in (0, \tau)’ but it should be 'y \in (\tau, \infty)’
otherwise the term \sqrt{y - \tau} is undefined.
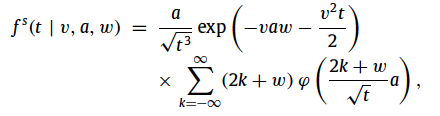
Two others based on reference paper (Blurton et at. 2012)
2. the exponent of the denominator (y - \tau) should be 3/2 instead of 3
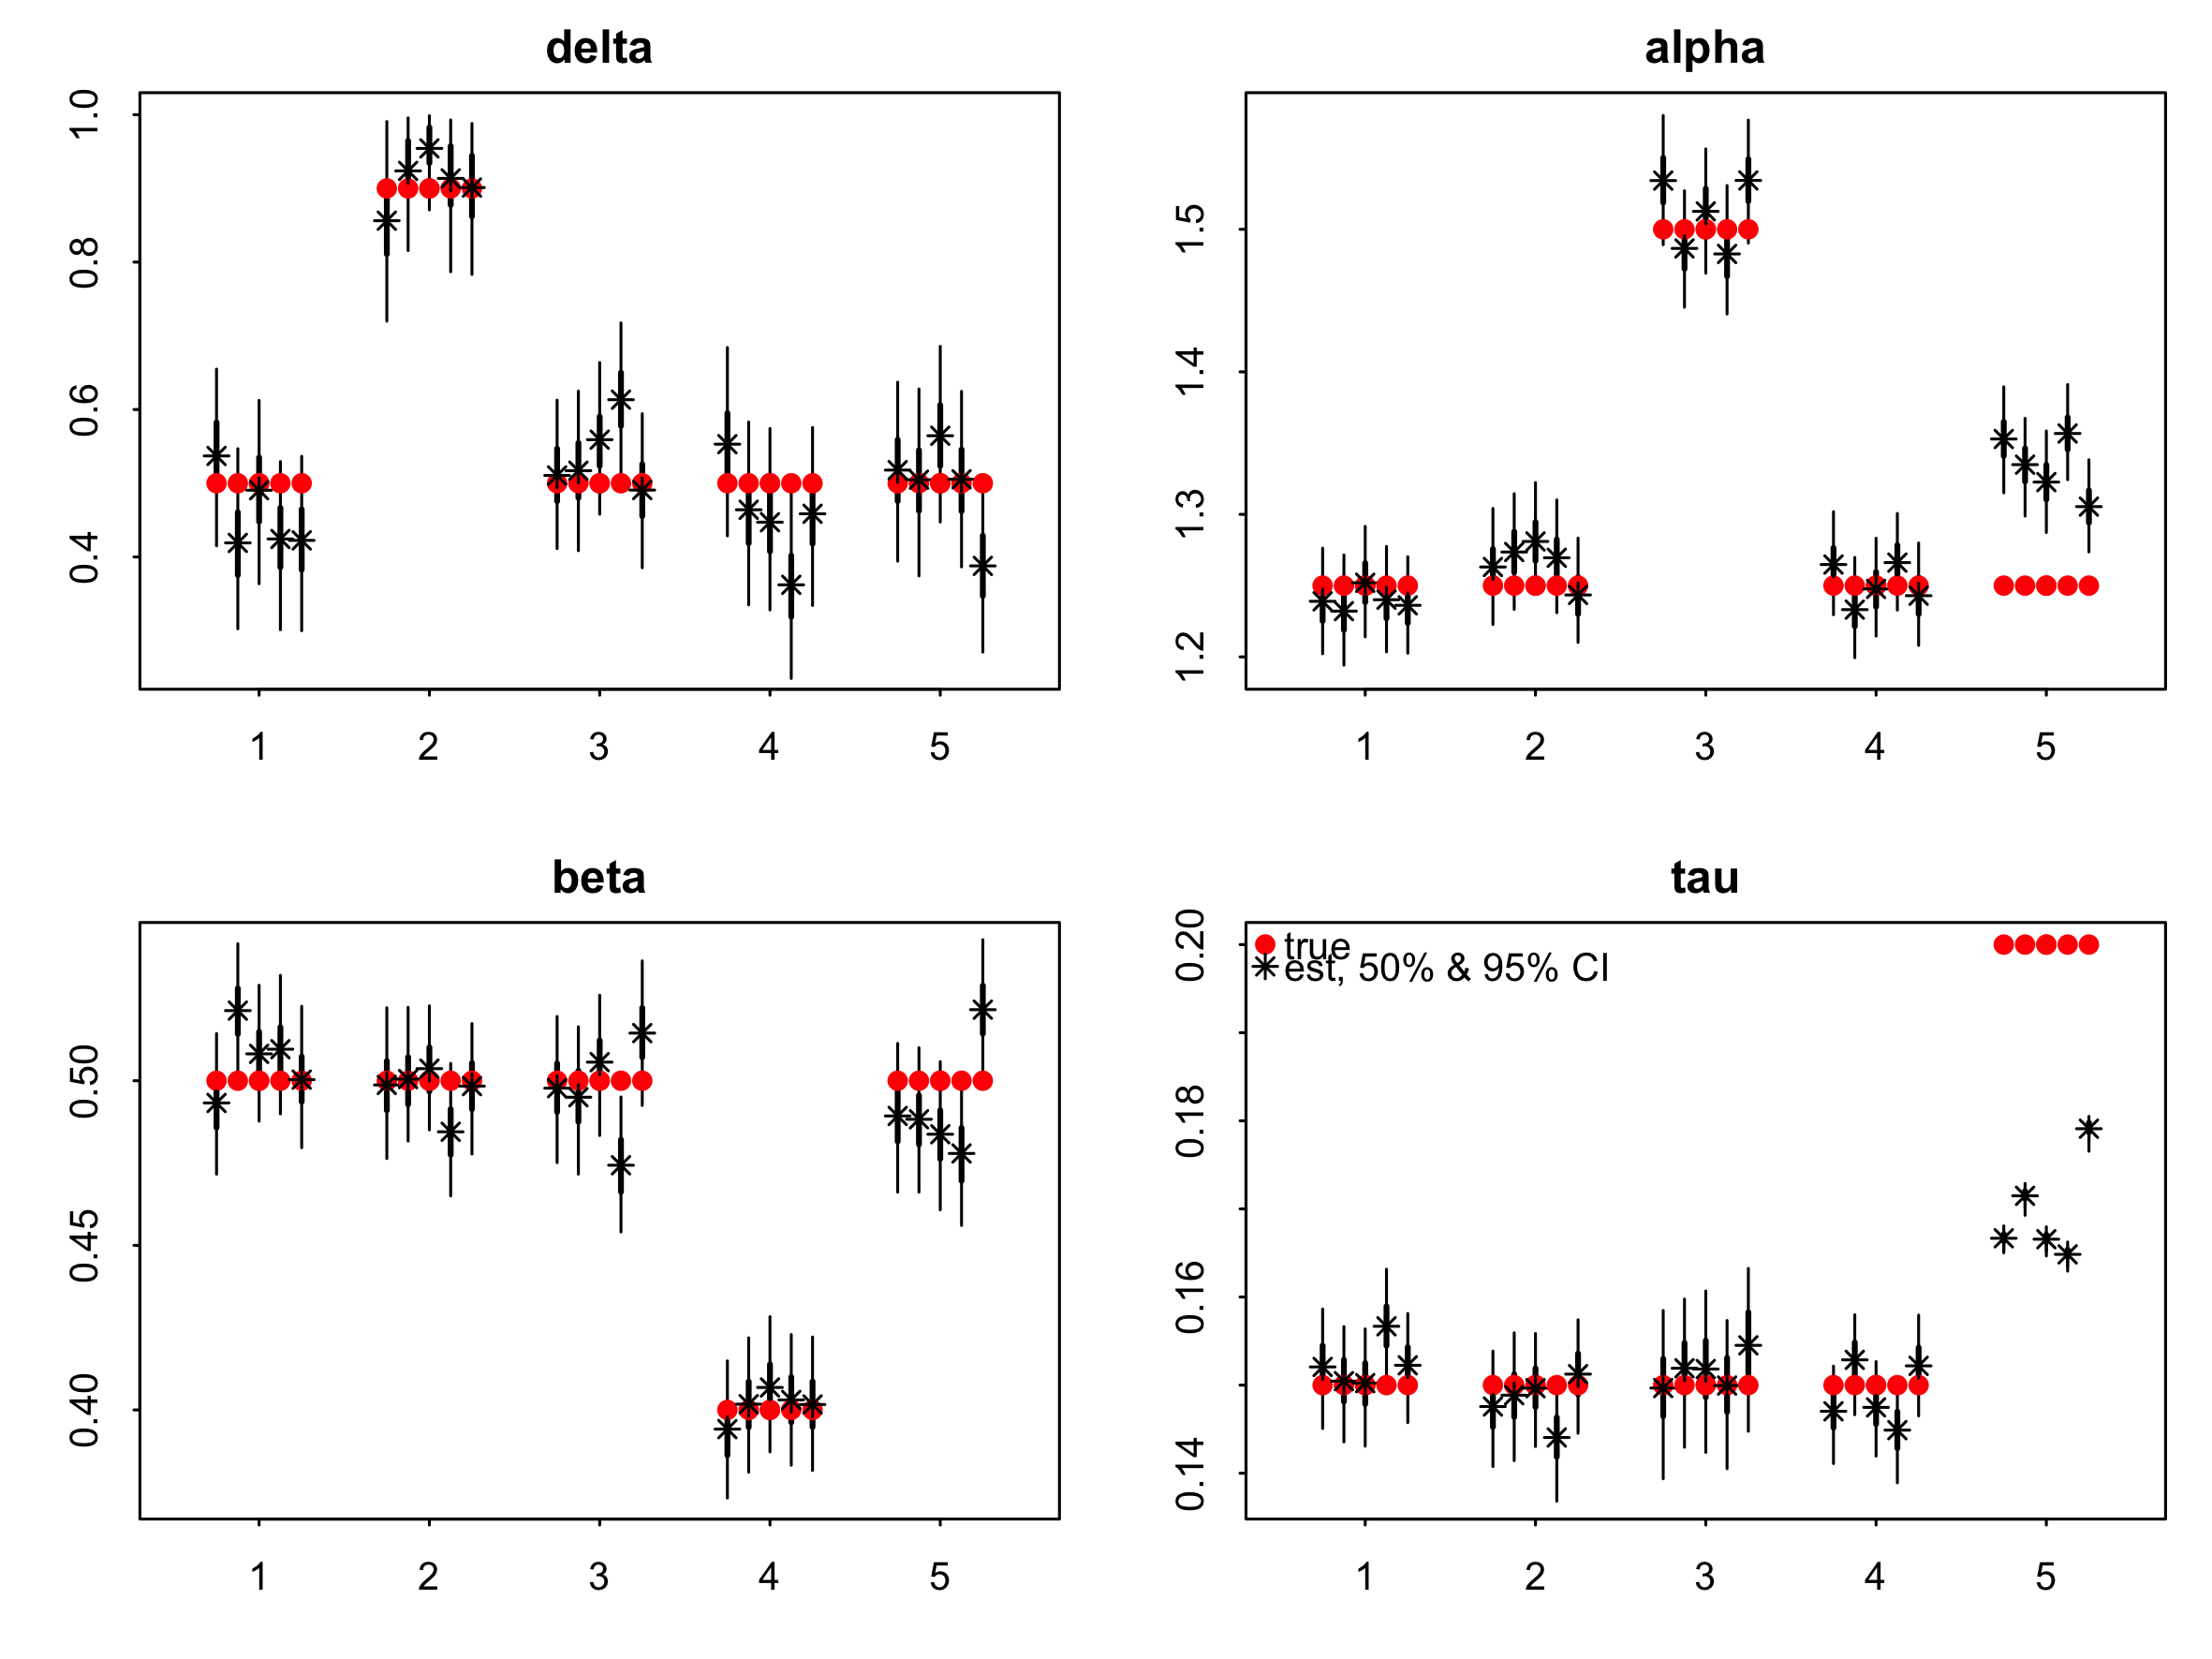
See attached PDF plots for
alphaB=3.25;tauB=0.25;betaB=0.4;deltaB=0.65; N = 150;
3. the numerator in standard normal distribution function \phi reads
‘(2k + \beta) \alpha’ instead of '2k + \alpha \beta’.
The difference between these two results in very minor changes.
Best Regards, Maciej
Bob Carpenter
Thanks for the detailed comments.
Could someone who understands this Wiener thing please respond
on stan-users?
I've never understood the function or its doc and we get a steady
stream of these messages saying it's wrong, which in the past
have been due to poor doc, not buggy code.
The next step would be to create reproducible errors.
- Bob
> You received this message because you are subscribed to the Google Groups "Stan users mailing list" group.
> To unsubscribe from this group and stop receiving emails from it, send an email to stan-users+...@googlegroups.com.
> To post to this group, send email to stan-...@googlegroups.com.
> For more options, visit https://groups.google.com/d/optout.
>
> --
> You received this message because you are subscribed to the Google Groups "Stan users mailing list" group.
> To unsubscribe from this group and stop receiving emails from it, send an email to stan-users+...@googlegroups.com.
> To post to this group, send email to stan-...@googlegroups.com.
> For more options, visit https://groups.google.com/d/optout.
Guido Biele
Guido Biele

Eric-Jan Wagenmakers
Bob Carpenter
distribution. Did its behavior change at some point? If so,
that got snuck in without my realizing, as I've been trying really
hard to enforce backward compatibility in the modeling language.
- Bob
Eric-Jan Wagenmakers
intuitive coding that was less error-prone. The Wiener process
produces two variables. One indicates response choice and is binary
(correct/error, or left/right, or whatever), the other indicates
response duration (or response time: rt) and is continuous. In the
JAGS code, these bivariate outcomes were captured in a single number
by using the sign. So .313 indicates an rt of 313 ms that ended up at
the upper bound, and -.400 indicates an rt of 400 ms that ended up at
the lower bound.
In the Stan code, the negative sign was eliminated and only positive
numbers can be used. Confronted with lower bound responses, the user
now needs to invert both the starting point and the drift rate. This
doubles the Stan code length and increases the probability of making
an error.
I can understand that the original idea was "what the hell are these
negative times good for?", but they were there for a very good reason.
The code still works, but reverting to the old input procedure (the
one with the negative rts) would be a good idea, imo.
Cheers,
E.J.
********************************************
Eric-Jan Wagenmakers
Department of Psychological Methods, room G 0.29
University of Amsterdam, Nieuwe Prinsengracht 129B
Letter: PO Box 15906, 1001 NK Amsterdam
Parcel: Valckenierstraat 59, 1018 XE Amsterdam
Web: ejwagenmakers.com
Book: bayesmodels.com
Stats: jasp-stats.org
Email: EJ.Wage...@gmail.com
Phone: (+31) 20 525 6420
“Man follows only phantoms.”
Pierre-Simon Laplace, last words
********************************************
> To unsubscribe from this topic, visit https://groups.google.com/d/topic/stan-users/-6wJfA-t2cQ/unsubscribe.
> To unsubscribe from this group and all its topics, send an email to stan-users+...@googlegroups.com.
Bob Carpenter
and deprecate the old one --- I don't like breaking backward
compatibility!
If someone wants to do this, it should be a relatively straightforward
project (if you can figure out what the whole thing does, that is).
- Bob

matus.s...@privatdemail.net
In the JAGS code, these bivariate outcomes were captured in a single number
by using the sign. So .313 indicates an rt of 313 ms that ended up at
the upper bound, and -.400 indicates an rt of 400 ms that ended up at
the lower bound.
I use the negative response time values to flag the special cases and hence I'm in favor of the two-vector representation. In addition, it's consistent with the representation used by generalized linear models of response time-accuracy trade-off in IRT (e.g. van der Linden, W. J. (2007). A hierarchical framework for modeling speed and accuracy on test items. Psychometrika, 72(3), 287-308.) Sure, I and the IRT folks can translate our code to fit the specification used by response-time modelers. Sure I can add a vector or two that encodes thresholds. But then I have to complain that this "doubles the Stan code length and increases the probability of making an error".
Eric-Jan Wagenmakers
Well, the model is very popular in RT research, from which field it originated. I would use the coding that most users are comfortable with.
Cheers,
EJ
--
Joachim Vandekerckhove
There really is a single canonical solution; at least as far as the diffusion model is concerned. It's a bivariate model so the likelihood should be bivariate. I certainly understand that people are uncomfortable with the negative-RTs hack, and it's not good coding practice. But neither is implementing a bivariate distribution as two conditional univariate distributions.
Since there is a concern with breaking backward compatibility, I second Bob's suggestion of introducing a new distribution, suggest we explicitly label it bivariate and call it the "double Wiener distribution" and I can provide code to implement ~dwiener() if someone can help me translate it to the correct C prototypes and whatnot.
I think that will satisfy everyone involved.
Joachim
Bob Carpenter
You should just be able to follow the existing C++
code. Also see:
https://github.com/stan-dev/stan/wiki/Contributing-New-Functions-to-Stan
And the rest of the wiki has info on the full developer process.
- Bob