A test between "mini horn" and a parabolic dish

JAN LUSTRUP - LA3EQ
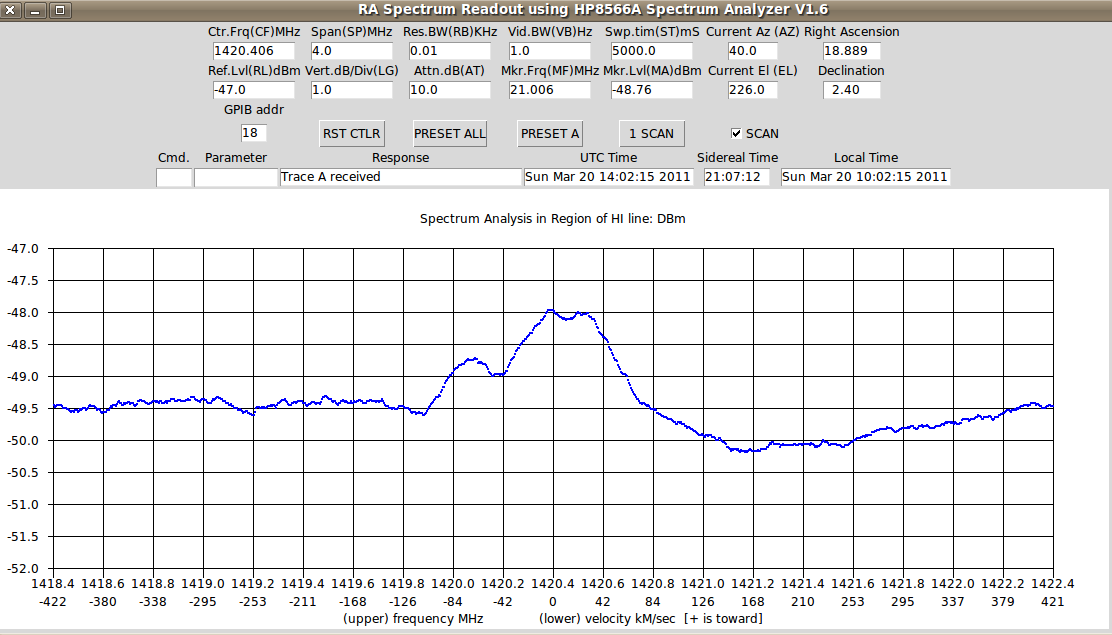
the 1420MHz hydrogen line.
"http://www.qsl.net/la3eq/radioastronomy/para_horn.gif"
The link above is a gif image of the comparison between a satelite
parabolic offset dish and my homemade "mini horn" antenna.
Two 1MHz width scans from 1420MHz to 1421MHz with two different
antennas.
Both recordings have the same RA, Dec, LNA, intergration time, and
amplification, but offset is not the same.
Even though the parabolic dish has more gain, it was “seeing” too
much ground noise over the antenna rim, I had to adjust the offset
voltage down very much so both lines show the same recording level at
start on both charts.
1.2 X 1.35m sat band parabolic dish = capture area 1.62m²
(w / 1420MHz coffee can feed)
vs
0,76 x 0,97.5m mini horn = capture area of only 0.74m²
I layed out many square feet of "chicken wire mesh" behind the dish to
eliminate as much ground noise as possible (this mesh is good at 21cm
band).
Jan Lustrup LA3EQ
Norway

John DuBois
Nice results, very good job.
What was the RA for these recordings? I happened to be making some
similar recordings today between UTC 13:00 and 14:00, looking at RA
between 18 and 19 hrs, and DEC 2.4. If we were pointed anywhere near the
same, it would be interesting to compare.
On 03/20/2011 01:19 PM, JAN LUSTRUP - LA3EQ wrote:
> I did a test today between my mini Horn and a 1,2m parabolic dish on
> the 1420MHz hydrogen line.
>
> "http://www.qsl.net/la3eq/radioastronomy/para_horn.gif"
>
> The link above is a gif image of the comparison between a satelite
> parabolic offset dish and my homemade "mini horn" antenna.
> Two 1MHz width scans from 1420MHz to 1421MHz with two different
> antennas.
> Both recordings have the same RA, Dec, LNA, intergration time, and
> amplification, but offset is not the same.
> Even though the parabolic dish has more gain, it was �seeing� too
> much ground noise over the antenna rim, I had to adjust the offset
> voltage down very much so both lines show the same recording level at
> start on both charts.
>
> 1.2 X 1.35m sat band parabolic dish = capture area 1.62m�
> (w / 1420MHz coffee can feed)
>
> vs
>
> 0,76 x 0,97.5m mini horn = capture area of only 0.74m�

James H Van Prooyen
| Hi Jan I just completed my own 1420 MHz Horn based on Paul Shuch's "SETI Horn of Plenty" paper which is located here: http://www.setileague.org/articles/horn.htm I found your comparison very helpful, and I will use the data to explain why a Dish is not always the best antenna for a given location. Thanks Jim Van Prooyen --- On Sun, 3/20/11, JAN LUSTRUP - LA3EQ <j-lu...@online.no> wrote: |
|
jan lustrup LA3EQ
It was at RA 06 and the Dec was +40.
I am finished with the 1420MHz sky survay. They are all 1 MHz wide starting
at 1420.000MHz to 1421.000MHz. All are in AM mode, no AGC and filter BW of
only 4.5 kHz.
I have all my recordings (241 files and images) from RA00 to RA23( one hour
steps) and from Dec-10 to +90 (10 degree steps) on my homepage, you can
download eighter any raw radioskypipe data og just the images (windows
format)....here is how to.:
For raw data that you can load into your Radio skypipe program. These files
reside in folder:
http://www.qsl.net/la3eq/radioastronomy/profiles/
for example: RA06_30dec.spd
This will get you the raw data from my survey of RA06:00 hours and Dec +30
degrees. remember to use "underscore" and NOT "space" between RA and dec
values.
For images only it's a little different. The image folder is at:
http://www.qsl.net/la3eq/radioastronomy/profiles/images/
(Here you write only the value for RA then "underscore" and then value for
dec. Don't included the letters RA and dec)
for example: 06_30.emf
This will get you the windows image file for RA06:00 hours and Dec+30
ForDec of minus 10 use the format of "m10" meaning minus 10 .
Feel free to download and play around with these radio skypipe files of the
hydrogen line profiles. Some of the recording are in UTC time and the rest
in LMST timestamp.
Jan Lustrup LA3EQ
Norway
Jan,
--
jan lustrup LA3EQ
----- Original Message -----From: James H Van Prooyen
James H Van Prooyen
| Hi The list server does not like my attachments, so I will send them one at a time :( Picture of Horn antenna... Jim Van Prooyen --- On Sun, 3/20/11, jan lustrup LA3EQ <j-lu...@online.no> wrote: |
John DuBois
Ok, well we were pointing pretty far apart, but I'll pull down your
survey data and have a look. I can't get my dish quite high enough to
reach a declination of 40 degrees, but I'll see how close I can get and
perhaps we could still make some rough comparisons. With a 4M dish, I
have an angular resolution of about 3.5 degrees and I am seeing separate
velocity features, typical of the screenshot attached.