potential memory leak and performance issue.
800 views
Skip to first unread message

Khai Do
May 20, 2016, 7:53:31 PM5/20/16
to Repo and Gerrit Discussion
Hello all,
We are running Gerrit ver 2.11.4 (with one plugin 'javamelody'). We run it as a service by running `gerrit.sh run`.
After running for about 2 weeks our Gerrit will become very slow and non responsive. We notice that when this happens our Gerrit is in the middle of a java garbage collection (indicated by javamelody) cycle and our Gerrit server CPU utilization goes way up[1]. At the same time Gerrit seems to have eaten up all of the system memory[2]. We also noticed that our Gerrit starts at the initial heap of 30 Gb (as expected) but over time it seems to
eat up all the server's memory[3].
I'm looking for help to determine whether this might be a memory leak issue or whether there is some configuration thing we should do to help alleviate this problem? Also I was wondering if anybody else is experiencing this same issue?
System: Ubuntu Trusty 14.04.4 LTS, 16 cores, 60 GB physical memory
java version "1.7.0_79"
OpenJDK Runtime Environment (IcedTea 2.5.6) (7u79-2.5.6-0ubuntu1.14.04.1)
OpenJDK 64-Bit Server VM (build 24.79-b02, mixed mode)
We replicate to 8 git slaves and most everyone clones from those slaves.
We do _not_ run gerrit gc but rather run a daily cron job to repack our repos ('git repack -afd')
Here is our config:
[container]
heaplimit = 30g
[core]
packedGitOpenFiles = 4096
packedGitLimit = 400m
packedGitWindowSize = 16k
[sshd]
threads = 100
[index]
threads = 4
[httpd]
maxQueued = 200

luca.mi...@gmail.com
May 21, 2016, 4:15:30 AM5/21/16
to Khai Do, Repo and Gerrit Discussion
What's you cache status?
Gerrit cache config and show cache command output?
Sent from my iPhone
Sent from my iPhone
--
--
To unsubscribe, email repo-discuss...@googlegroups.com
More info at http://groups.google.com/group/repo-discuss?hl=en
---
You received this message because you are subscribed to the Google Groups "Repo and Gerrit Discussion" group.
To unsubscribe from this group and stop receiving emails from it, send an email to repo-discuss...@googlegroups.com.
For more options, visit https://groups.google.com/d/optout.

Matthias Sohn
May 21, 2016, 5:10:28 AM5/21/16
to Khai Do, Repo and Gerrit Discussion
On Sat, May 21, 2016 at 1:53 AM, Khai Do <zaro...@gmail.com> wrote:
Hello all,We are running Gerrit ver 2.11.4 (with one plugin 'javamelody'). We run it as a service by running `gerrit.sh run`.After running for about 2 weeks our Gerrit will become very slow and non responsive. We notice that when this happens our Gerrit is in the middle of a java garbage collection (indicated by javamelody) cycle and our Gerrit server CPU utilization goes way up[1]. At the same time Gerrit seems to have eaten up all of the system memory[2]. We also noticed that our Gerrit starts at the initial heap of 30 Gb (as expected) but over time it seems toeat up all the server's memory[3].I'm looking for help to determine whether this might be a memory leak issue or whether there is some configuration thing we should do to help alleviate this problem? Also I was wondering if anybody else is experiencing this same issue?System: Ubuntu Trusty 14.04.4 LTS, 16 cores, 60 GB physical memoryjava version "1.7.0_79"OpenJDK Runtime Environment (IcedTea 2.5.6) (7u79-2.5.6-0ubuntu1.14.04.1)OpenJDK 64-Bit Server VM (build 24.79-b02, mixed mode)We replicate to 8 git slaves and most everyone clones from those slaves.We do _not_ run gerrit gc but rather run a daily cron job to repack our repos ('git repack -afd')
are you using bitmap indexes ?
Here is our config:[container]heaplimit = 30g[core]packedGitOpenFiles = 4096packedGitLimit = 400m
packedGitLimit is way too small, it's the main JGit object cache. Ideally it's as large as the sum of
all your actively used repositories so that you can serve most requests from memory.
packedGitWindowSize = 16k[sshd]threads = 100[index]threads = 4[httpd]maxQueued = 200
do you monitor / log the Java garbage collector runs ?
Do you limit max object size ? We introduced this limit since we observed problems when users tried to push
packs containing huge files.
You may consider to create a heap dump (ensure you have enough disk space to store it) and analyze it using MAT [2].
Run the MAT analysis on a large box using MAT headless mode. Run the script mentioned in [3] to analyse the dump,
it's contained in the MAT download.
$ ./ParseHeapDump.sh path/to/dump.dmp.zip org.eclipse.mat.api:suspects org.eclipse.mat.api:overview org.eclipse.mat.api:top_components
Then copy the dump and all the files MAT analysis created to a folder on your local machine and inspect it using MAT's UI.
Heap dumps compress well so it may save time to first zip the dump before copying it over the network.
[1] https://gerrit-review.googlesource.com/Documentation/config-gerrit.html#receive.maxObjectSizeLimit
[3] http://wiki.eclipse.org/MemoryAnalyzer/FAQ#How_to_run_on_64bit_VM_while_the_native_SWT_are_32bit
-Matthias
Khai Do
May 23, 2016, 1:59:54 PM5/23/16
to Repo and Gerrit Discussion, zaro...@gmail.com
On Saturday, May 21, 2016 at 2:10:28 AM UTC-7, Matthias Sohn wrote:
On Sat, May 21, 2016 at 1:53 AM, Khai Do <zaro...@gmail.com> wrote:Hello all,We are running Gerrit ver 2.11.4 (with one plugin 'javamelody'). We run it as a service by running `gerrit.sh run`.After running for about 2 weeks our Gerrit will become very slow and non responsive. We notice that when this happens our Gerrit is in the middle of a java garbage collection (indicated by javamelody) cycle and our Gerrit server CPU utilization goes way up[1]. At the same time Gerrit seems to have eaten up all of the system memory[2]. We also noticed that our Gerrit starts at the initial heap of 30 Gb (as expected) but over time it seems toeat up all the server's memory[3].I'm looking for help to determine whether this might be a memory leak issue or whether there is some configuration thing we should do to help alleviate this problem? Also I was wondering if anybody else is experiencing this same issue?System: Ubuntu Trusty 14.04.4 LTS, 16 cores, 60 GB physical memoryjava version "1.7.0_79"OpenJDK Runtime Environment (IcedTea 2.5.6) (7u79-2.5.6-0ubuntu1.14.04.1)OpenJDK 64-Bit Server VM (build 24.79-b02, mixed mode)We replicate to 8 git slaves and most everyone clones from those slaves.We do _not_ run gerrit gc but rather run a daily cron job to repack our repos ('git repack -afd')are you using bitmap indexes ?
No, we do not. Our cron repack doesn't generate those. I've heard bitmap indexes can speed up performance but I think it's the exhaustion of memory is what's causing the performance degradation.
Here is our config:[container]heaplimit = 30g[core]packedGitOpenFiles = 4096packedGitLimit = 400mpackedGitLimit is way too small, it's the main JGit object cache. Ideally it's as large as the sum ofall your actively used repositories so that you can serve most requests from memory.
We have about ~1080 repos. Our largest repo by size is ~400 Mb. Was wondering what is your metric for *actively used*? Could you suggest the best way to find out which ones are the most *actively used* repositories? Also was wondering how this affects JVM memory and GC?
packedGitWindowSize = 16k[sshd]threads = 100[index]threads = 4[httpd]maxQueued = 200do you monitor / log the Java garbage collector runs ?
The javamelody plugin logs that for us however it's not persisted across restarts.
Do you limit max object size ? We introduced this limit since we observed problems when users tried to pushpacks containing huge files.
Not at the moment. We had planned to limit to '100 m'. Was this something that was causing memory issues for you?
You may consider to create a heap dump (ensure you have enough disk space to store it) and analyze it using MAT [2].Run the MAT analysis on a large box using MAT headless mode. Run the script mentioned in [3] to analyse the dump,it's contained in the MAT download.$ ./ParseHeapDump.sh path/to/dump.dmp.zip org.eclipse.mat.api:suspects org.eclipse.mat.api:overview org.eclipse.mat.api:top_componentsThen copy the dump and all the files MAT analysis created to a folder on your local machine and inspect it using MAT's UI.Heap dumps compress well so it may save time to first zip the dump before copying it over the network.
Thanks for the suggestion, will look into this.
Khai Do
May 23, 2016, 2:29:27 PM5/23/16
to Repo and Gerrit Discussion, zaro...@gmail.com
On Saturday, May 21, 2016 at 1:15:30 AM UTC-7, lucamilanesio wrote:
What's you cache status?Gerrit cache config and show cache command output?
We are not setting anything specific for cache, we are just using the Gerrit default cache settings.
show-caches output: http://paste.openstack.org/show/498238/
and snapshots of the memory when we ran that command:
weekly average: http://cacti.openstack.org/cacti/graph.php?action=zoom&local_graph_id=27&rra_id=2&view_type=&graph_start=1463422789&graph_end=1464027589
Uptime is ~5 days which means we have about another 5 days until our server starts to intermittently returning 503 Errors. Once we restart everything works smoothly again.
Luca Milanesio
May 23, 2016, 5:16:04 PM5/23/16
to Khai Do, Repo and Gerrit Discussion
On 23 May 2016, at 19:29, Khai Do <zaro...@gmail.com> wrote:
On Saturday, May 21, 2016 at 1:15:30 AM UTC-7, lucamilanesio wrote:What's you cache status?Gerrit cache config and show cache command output?We are not setting anything specific for cache, we are just using the Gerrit default cache settings.
Those are typically good for small-medium sized set-up ... defaults are 1024 (for everything) and 1h TTL with the exceptions reported in https://gerrit-review.googlesource.com/Documentation/config-gerrit.html.
For highly loaded set-ups, I tend to make sure that repos meta / project info is always in cache to avoid stressing the JGit layer too much in opening and decoding them all the times.
show-caches output: http://paste.openstack.org/show/498238/and snapshots of the memory when we ran that command:weekly average: http://cacti.openstack.org/cacti/graph.php?action=zoom&local_graph_id=27&rra_id=2&view_type=&graph_start=1463422789&graph_end=1464027589Uptime is ~5 days which means we have about another 5 days until our server starts to intermittently returning 503 Errors. Once we restart everything works smoothly again.
What I think is really strange is the fact that you have set 30GB as your Heap limit ... but the used memory ramps up anyway until your system memory is exhausted.
Have you checked the other graphs in JavaMelody if any other metric is growing?
Sometimes the memory is eaten up by other native system-level allocations.
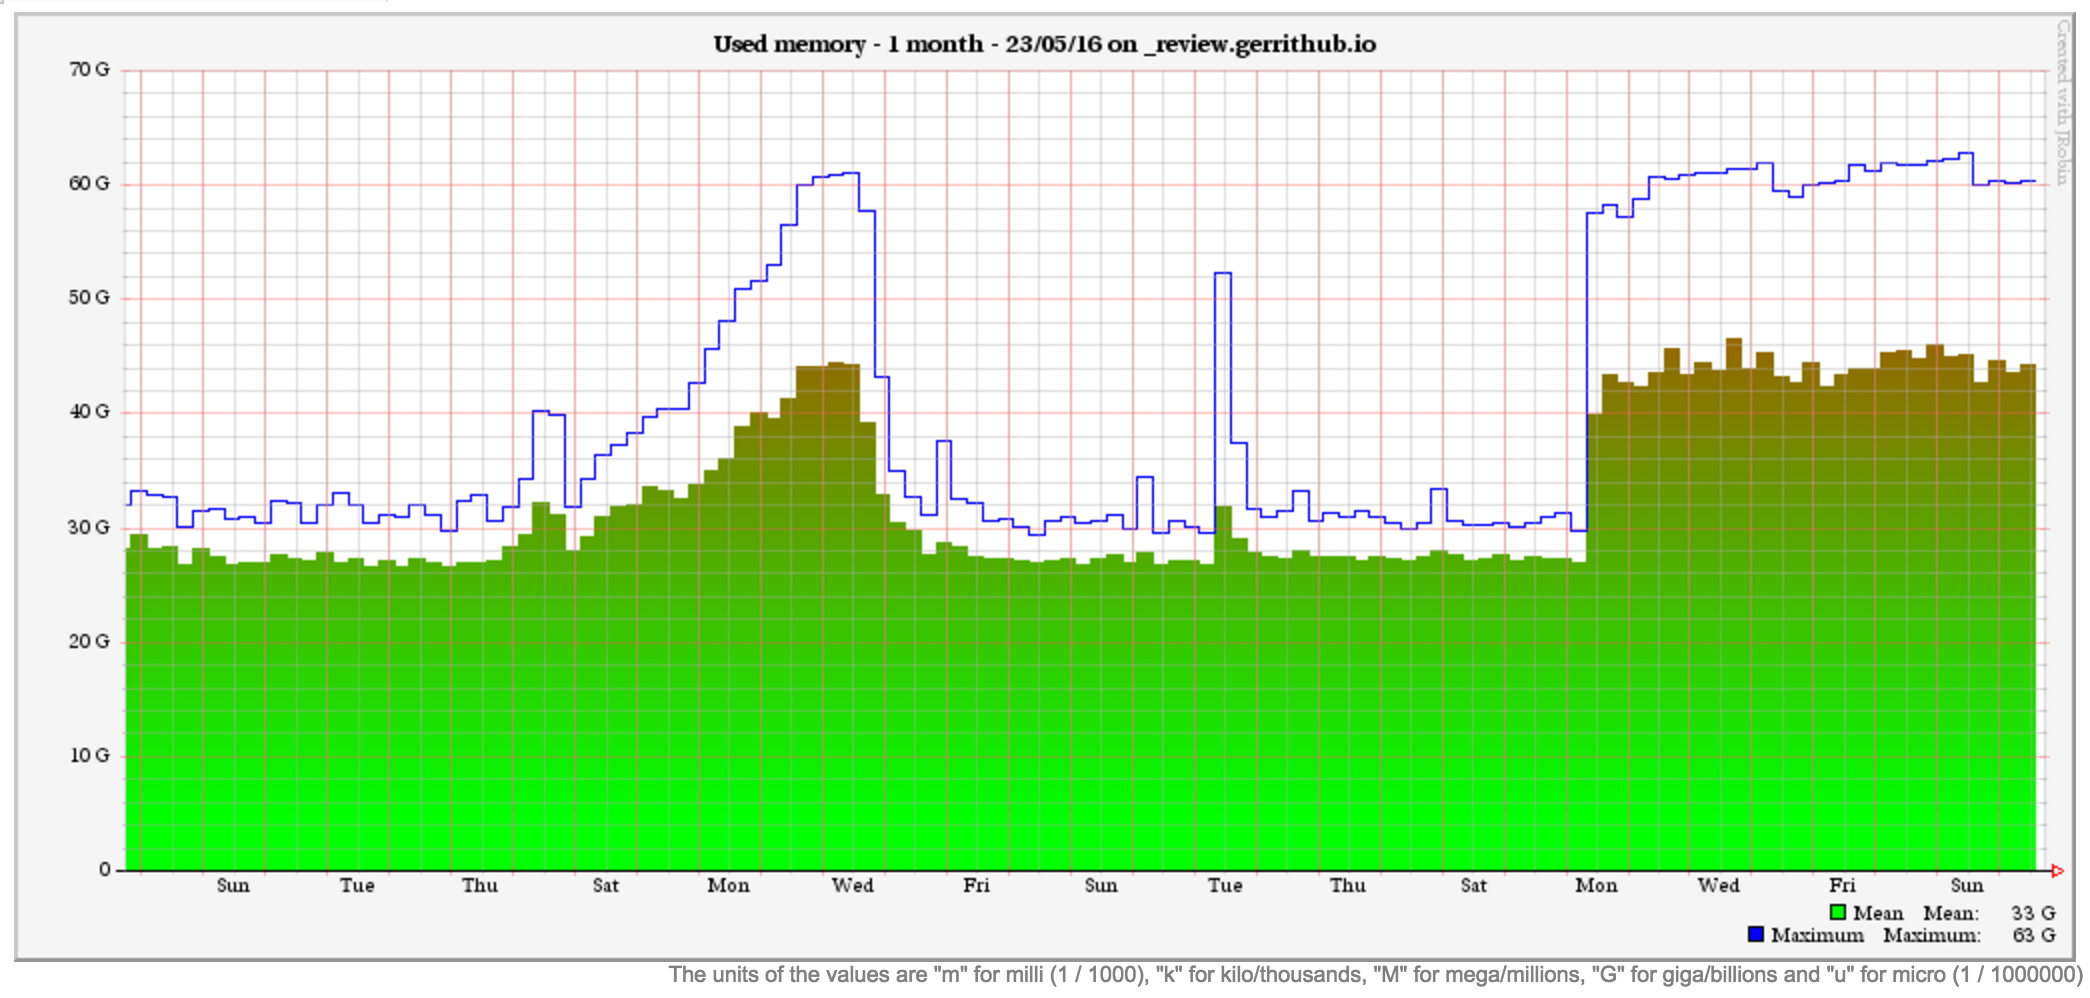
Our peak usage is over 2 times your JVM Heap limit but we have a lot more users and repos.
On our old infrastructure we had only 64 GB of RAM (similar to your config) and from times to times we had JVM overheads during peak times, mainly due to JGit cache overflow.
As you can see *IF* we resist to manage the peaks during the week, the load typically goes down over the week-end because the cache expires.
Luca.
Matthias Sohn
May 23, 2016, 6:57:00 PM5/23/16
to Khai Do, Repo and Gerrit Discussion
search for receive-pack (some client pushes a pack) and upload-pack (some client fetches)
in sshd_log and httpd_log and extract list of distinct repositories from that list. Then sum up
size of these repositories to get an estimate of ideal cache size
One of our servers serves 14k repositories with a total size of ~100GB,
for that we use packedGitLimit=96g and heaplimit=256g. So far we don't
use read-only slaves.
packedGitWindowSize = 16k[sshd]threads = 100[index]threads = 4[httpd]maxQueued = 200do you monitor / log the Java garbage collector runs ?The javamelody plugin logs that for us however it's not persisted across restarts.
do you observe excessive gc runs before the OOM happens ?
Do you limit max object size ? We introduced this limit since we observed problems when users tried to pushpacks containing huge files.Not at the moment. We had planned to limit to '100 m'. Was this something that was causing memory issues for you?
yes, definitively
Some user tried to push 700MB ISO CD images
We also observed users trying to use a git repository to store database backups, others used git as a backup system.
Hence we limit max file size to 20MB
You may consider to create a heap dump (ensure you have enough disk space to store it) and analyze it using MAT [2].Run the MAT analysis on a large box using MAT headless mode. Run the script mentioned in [3] to analyse the dump,it's contained in the MAT download.$ ./ParseHeapDump.sh path/to/dump.dmp.zip org.eclipse.mat.api:suspects org.eclipse.mat.api:overview org.eclipse.mat.api:top_componentsThen copy the dump and all the files MAT analysis created to a folder on your local machine and inspect it using MAT's UI.Heap dumps compress well so it may save time to first zip the dump before copying it over the network.Thanks for the suggestion, will look into this.
--

Clark Boylan
May 25, 2016, 1:04:33 PM5/25/16
to Matthias Sohn, Repo and Gerrit Discussion
the specified amount of heap memory and other system processes like
Apache are consuming additional memory, but memory pressure on the
system as a whole is not a problem. Instead what happens is Gerrit
consumes its allocated heap then spends a significant amount of time
GCing (java melody reports ~10% of cpu time spent GCing when things
get bad). When this happens Gerrit no longer processes all requests
quickly enough which makes the proxy unhappy and leads to errors
reported to users.
To answer your question yes, we observe excessive GC runs, but no OOM
occurs. Instead we get annoyed enough that we restart the service and
let the leak start over again.

Hugo Arès
Sep 19, 2016, 5:45:54 AM9/19/16
to Repo and Gerrit Discussion
We had a very similar issue with our Gerrit master, memory usage would increase slowly over time to reach the point were Gerrit start to be slow.
We did memory dumps and figure out that JGit repository cache was causing this issue for us. Per design this cache is keeping every opened repository in memory it's never closing them. As the repositories are getting used, more objects are loaded and kept in memory until you restart Gerrit.
A series of changes were done in JGit and now the repository cache have a time based eviction policy. This is available in JGit 4.4.1 (Gerrit 2.13).
You have 2 options, either you make your Gerrit heap really big to hold all repositories in memory or you can patch jgit to include all changes related to repository cache. We did the latter in Gerrit 2.11(JGit 4.0) and 2.12 (JGit 4.1) and it solved our memory usage problems. There is one thing you need to be careful is now that JGit will no longer keep all repositories in memory, you need to make sure your Gerrit projects cache is big enough to hold all your projects otherwise operation that need to go through all projects will be slower (e.g. ls-projects).
If you want to patch JGit 4.0, here is the list of change you must cherry pick in order:
git cherry-pick d34314644ef9f7d85a94737653322eafa5a8b1b0 (API to remove repositories from RepositoryCache)
git cherry-pick 83235432e7fd789261cad7729bf3febfc168cd6f (Fix repository cache never closing repository)
git cherry-pick 53ea86cd7be3859ff741ea2b9760396ffabf5fe0 (Fix RefDirectory not closing resources)
git cherry-pick 7d2b3b9e25a430241a2d277e0cb222ad40cd0c2c (Remove repository from cache when it's closed)
git cherry-pick 26862bb834b90722d6290181f8776711d8a7d10d (Extract work queue to allow reusing it)
git cherry-pick 7ffe547da79bf26301c5e5a0665d19a233b44818 (Time based eviction strategy for repository cache)
The last change cherry-pick cleanly but you need to remove @NonNull annotation and import from RepositoryCache otherwise it won't compile.
If you want to patch JGit 4.1, the list is almost the same, only skip the first one because it's already in 4.1
luca.mi...@gmail.com
Sep 19, 2016, 7:01:27 AM9/19/16
to Hugo Arès, Repo and Gerrit Discussion
We discovered that a side effect of the SSH sessions not timing out was a huge memory leak on the JGit packs indexes which prevented the soft-links pointers to objects to expire.
Once the sessions started timing out correctly and were removed, the heap was (slowly) coming back under control.
I'm going to see the time based eviction makes the heap recovery even faster :-) thanks for sharing it.
Luca

Shawn Pearce
Sep 19, 2016, 11:52:24 AM9/19/16
to Khai Do, Repo and Gerrit Discussion
On Mon, May 23, 2016 at 10:59 AM, Khai Do <zaro...@gmail.com> wrote:
On Saturday, May 21, 2016 at 2:10:28 AM UTC-7, Matthias Sohn wrote:are you using bitmap indexes ?No, we do not. Our cron repack doesn't generate those. I've heard bitmap indexes can speed up performance but I think it's the exhaustion of memory is what's causing the performance degradation.
Since there is a lot of discussion in this thread about memory, let me just state that bitmap indexes can significantly reduce the memory demand required to process a clone. During clone every object in the repository has to be represented in memory. If a repository has 3M objects, JGit needs something like 384 MiB of memory for that clone request. With bitmap indexes that number can drop considerably.
Reply all
Reply to author
Forward
0 new messages