Fibrosis/Collagen quantification
3,587 views
Skip to first unread message

Doug Mack
Nov 7, 2017, 5:27:13 PM11/7/17
to QuPath users
Has anyone used QuPath to quantify fibrosis (Trichrome) or collagen (PicroSirius Red) in tissue sections. While its easy to do in ImageJ using color deconvolution on low res images, I can't find a way to analyze the larger digital (SVS extension) using QuPath?

Pete
Nov 7, 2017, 5:42:05 PM11/7/17
to QuPath users
I can't answer your first question, except to say 'I haven't done it'. I never worked with that kind of data, so didn't create anything to help specifically. But it sounds like it is something that should be made easier/possible in QuPath as a built-in command in the future. If you can describe a bit more about what the outputs should be (area?) that would be good.
In the meantime, if it's easy to do with ImageJ and color deconvolution, then my suggestion would be to do the color deconvolution in QuPath and then send the region you want to ImageJ at a tolerable resolution (you can crop out on the relevant area if necessary). Then you can threshold in ImageJ, and use the ImageJ plugin (provided by QuPath) to 'Send ROI to QuPath'. All the shifting and resizing should happen automatically to enable you to see the detected region in the context of the whole slide.
Relevant bits of the documentation are:
For setting the stains in the first place, this may or may not be useful:
and also

micros...@gmail.com
Nov 7, 2017, 6:45:25 PM11/7/17
to QuPath users
The most straightforward, though computationally intensive method, would be to use Positive Pixel detection with color vectors set appropriately. The command shows "DAB" and "Hematoxylin" regardless of what the color vectors are, though, so you will need to keep track of which is red and which is blue. You also need to keep in mind the limits to this method, and set your Hematoxylin threshold low enough so as not to run into any errors, as described in https://github.com/qupath/qupath/issues/67.
In essence, you are providing the threshold that you would have normally used in ImageJ (like Pete described) as the DAB cutoff in the positive pixel detection.
Generally speaking, as long as your tissue detection is tight enough, you mostly want "what is blue" and "everything else" so this works out fine. The positive pixel detection command works MUCH faster on smaller slices, so if your tissue is large (or the command is running too slowly) I would also recommend looking into dividing your tissue up into Tiles and then running the command on all tiles, and summing the results of the Annotation Measurements.
The other way would be to divide the whole tissue up into SLICs, and then classify those based on their "redness" and "blueness" (and possibly OD sum if you have a lot of white space). You would have to play with the size and regularization variables in order to find the best tradeoff between accuracy and speed (or it running out of memory and not finishing).

dhlw...@gmail.com
Jun 29, 2018, 8:57:14 AM6/29/18
to QuPath users
Did you solve this one in the end Doug?
I'm playing with the same challenge but as a new user it's slow going.

Astin Powers
Jul 2, 2018, 1:36:21 PM7/2/18
to QuPath users
I have the same question. Also is there a way to overlay images to see how many positive cells are in each location?
micros...@gmail.com
Jul 2, 2018, 1:49:06 PM7/2/18
to QuPath users
If anyone wants to host up an image I will take a look at writing a few scripts for that particular image type/setup. I did not run into many problems getting a percentage area/intensity measurements for MTC or PSR.
As far as overlay, that is something that mostly needs to be done externally, to QuPath, but once the images are aligned, you can place all of the objects created in one image (say all of your cell detections) into a second image and classify them according to the new background.
I think the most recent reference/list of links can be found here: https://github.com/qupath/qupath/issues/178
dhlw...@gmail.com
Jul 4, 2018, 5:02:42 AM7/4/18
to QuPath users
I'll have a look, the images i'm working with are ~500Mb so i'd need to convert and compress i think.
micros...@gmail.com
Jul 4, 2018, 11:17:19 AM7/4/18
to QuPath users
You should be able to put something that small on your Google Drive for free and share a link publicly or privately. I have used that method with significantly larger images. If you are dealing with a metered connection, that might stll be an issue though.
dhlw...@gmail.com
Jul 5, 2018, 3:47:53 AM7/5/18
to QuPath users
Ah, excellent. I hadn't considered that.
Pete
Jul 5, 2018, 4:24:05 AM7/5/18
to QuPath users
Thanks, the image is very helpful. I've a couple of questions...
- Could you say a bit more about what the required output would be (e.g. area stained red divided by.... some other area)?
- Are only certain parts of the image of interest for analysis - and, if so, which parts?
- Is this kind of analysis common, and are there other applications with different stains that basically require the same kind of approach?
I never worked on images with this kind of staining, and so consequently there's currently no specific command in QuPath that is designed for it. There are some commands that might 'work' in a complicated or cumbersome way, and there's always the option to script something customized (like this)... but I'd rather think about creating a new command that makes the job easier, and is ideally as general as possible.
Ideas for what the ideal tool in QuPath would look like for this application are also very welcome.
(I've already done a bit of work on a new command that I think might help based upon training the software to identify certain colors - much like the cell classification training, but on a pixel level... but I'd like to better understand the requirements better & any other ideas)
dhlw...@gmail.com
Jul 5, 2018, 4:46:50 AM7/5/18
to QuPath users
Hi Pete, nice presentation at the IGMM last week. There's a few folk beginning to make good use of QuPath here and I'm hoping to get to grips with it for the bulk of my future image analysis.
So...
The tissue is liver, we use the defined fibrotic area as a read out of damage/recovery. Previously this was done using a macro in imageJ to measure pixels defined by thresholding as +ve vs. whole tissue area. We recently moved to obtain the scanned images using a Hamamatsu Nanozoomer which is a lot faster at acquisition than the previous scanning microscope the downside is that the nanozoomers .ndpi files don't play well in imageJ and the analysis pipeline is still rather lengthy and laborious.
The required output would be, ideally, a % of +ve (red) stained tissue against whole section.
Assuming the section is clean, i.e. without wrinkles or other artefacts, then the whole section is relevant.
I would imagine it is common in certain fields, if the histological stain or immunohistochemistry does not rely on localisation to a cell or nucleus, or if in our case we might use another architectural marker marker, like a duct, then area or specific zonal area would be important.
I've progressed so far to defining the staining vector for +ve and -ve, then Simple Tissue Detection for whole area. It then looks like for something of that size it needs to be tiled using Create Tiles. Following this, I would run the Positive Pixel count on all annotations (I appreciate it's experimental)
That's as far as I've practically got in the past couple of weeks. I would guess the next step would be to output the results to a spreadsheet and then have a look at how to creat a batch process that could run this workflow on a specified folder of images.
All help is much appreciated.!
Pete
Jul 5, 2018, 5:07:24 AM7/5/18
to QuPath users
Ah, you were there... then you'll have seen a video of the command I'm talking about (as it whizzed by near the end).
The approach you describe is also the one I would do if I need to make the best of the built-in commands. I suspect (but haven't checked) that the performance after positive pixel counting will be abysmal if applied to very large regions, because it results in generating huge numbers of vertices that need to be repainted when you want to pan/zoom on the image. There are some optimizations, but they depend on having lots of small regions - rather than a small number of very large regions. So yes, in that regard it might be necessary to create tiles... and then try to figure out how to put it all back together.
If you haven't already done so, you might want to check https://petebankhead.github.io/qupath/2018/03/19/qupath-updates.html
I've attempted to fix some elements of the Positive pixel count in response to feedback there, but while keeping essentially the same idea (and many of the same limitations).
There is also some information about the batch export at https://petebankhead.github.io/qupath/scripting/2018/03/04/script-annotation-export.html
If you were able to share the ImageJ macro (here or privately), it might be possible to replicate that in a QuPath script... although how worthwhile that is would I guess depend on how happy you were with the macro. If it was working perfectly, then that would be nice to replicate.
One other thing: I notice that the tissue seems to become slightly more red towards the boundaries (especially on the left) - and potentially this could result in pixels towards the edge being above some threshold; am I right to assume this is not something that you'd want reflected in the results..?
micros...@gmail.com
Jul 5, 2018, 12:51:26 PM7/5/18
to QuPath users
Yep, that looks like how I would do it as well. Tissue detection, color vectors, tiling, positive pixel count, then sum across annotations. I agree with Pete that the outer edges of the tissue will be problematic unless you want a very high threshold, which will remove a lot of the inner tissue accuracy. I can't think of a quick an easy way around that, other than excluding tiles or manually editing the simple tissue detection. Other areas that could be problematic are where there are smudges/shadows on the image, which will indiscriminately increase the positive pixel detection in those areas.
Excluding tiles might work to a certain extent, but it would be tricky to balance rationalizing those decisions vs manually editing the annotations (if %positive area >50%, discard tile seems safe if your tiles are large... but that would be quite a balancing act just for automation).
micros...@gmail.com
Jul 6, 2018, 1:24:58 PM7/6/18
to QuPath users
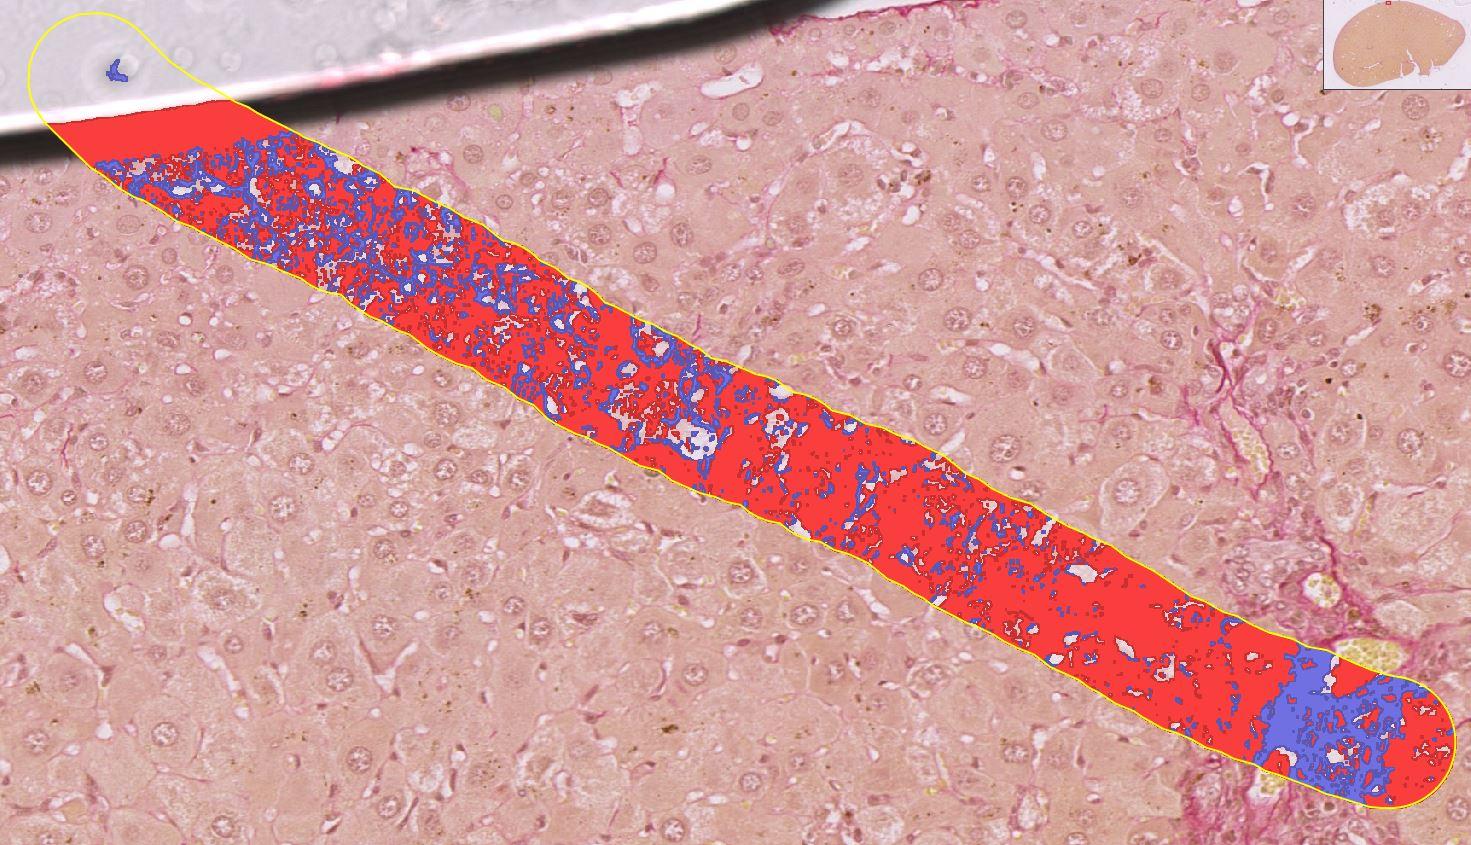
Ok, I took a better swing at this, though I only have V1.3 where I am currently at.
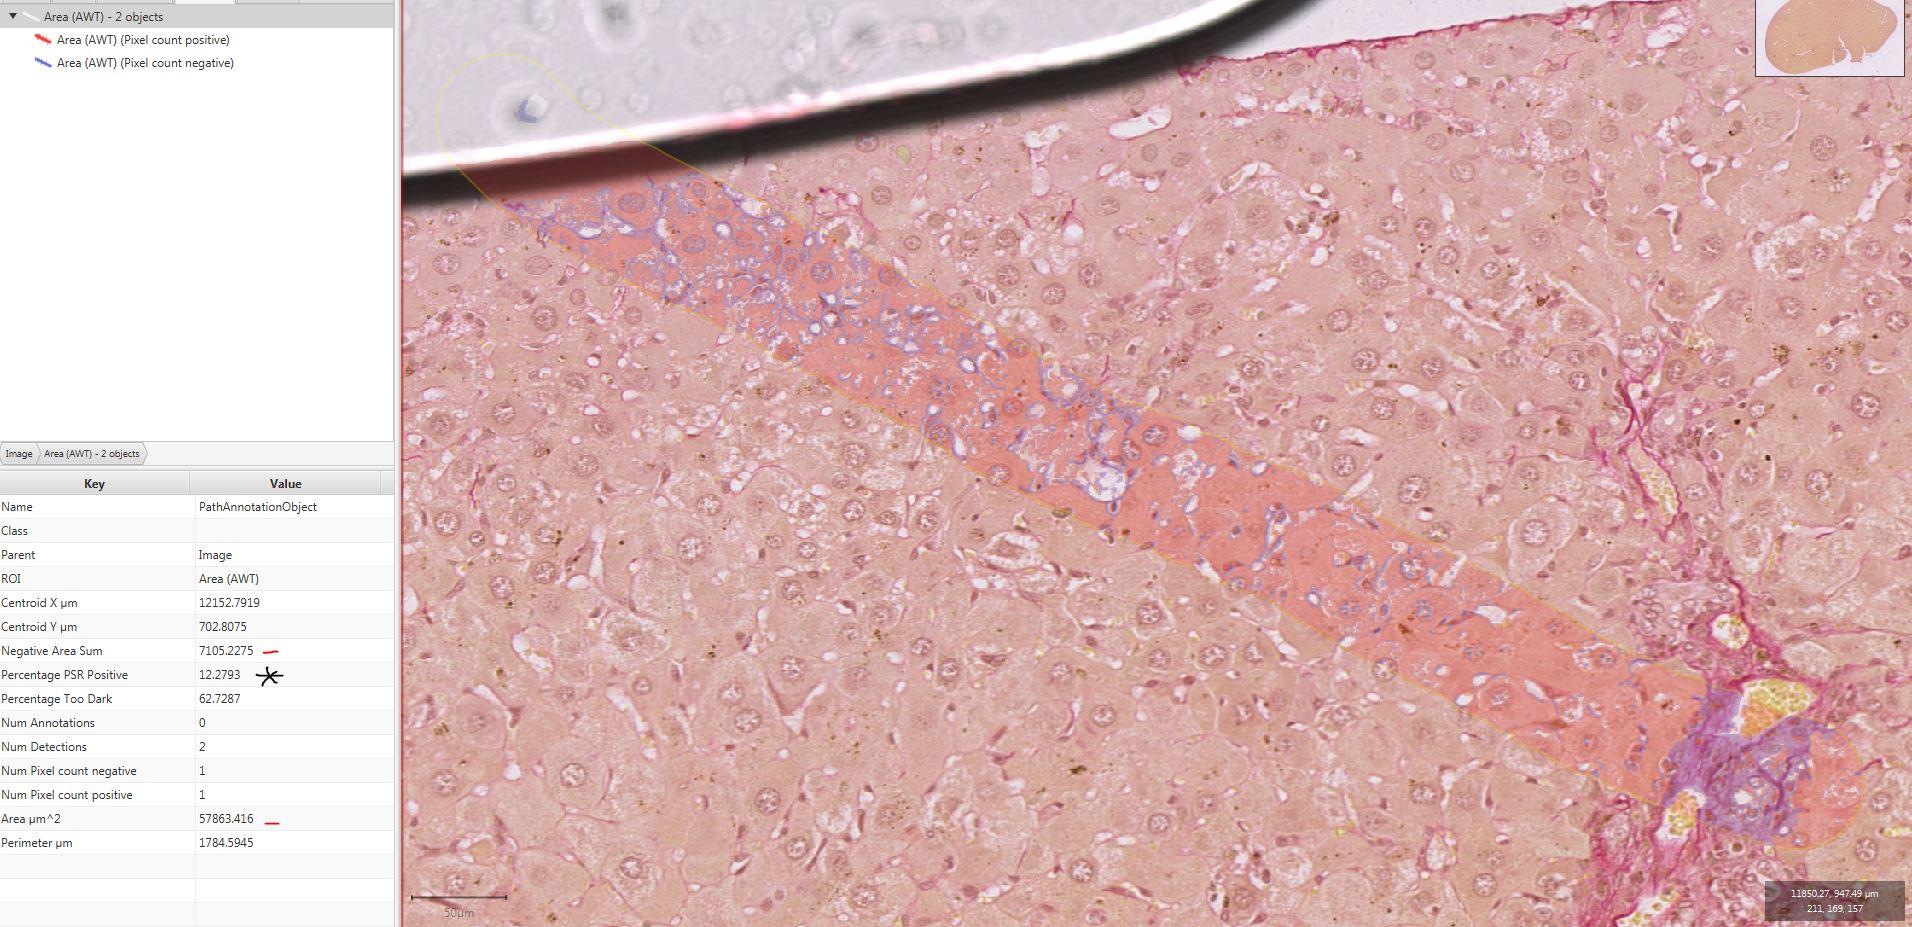
Attached is a small image of a small detection at the top of the tissue sample. What I did was use Red as the first color vector, and the brown background as the second. That allowed me to block out anything "too dark" that showed up above threshold in both Red and Brown. You can see in the image how the edge of the bubble is blocked off in red, while the negative gives a reasonably accurate representation of the PSR staining. I do not yet have any useful way to compensate for the increased red staining around the edges of the tissue, which is also noticeable here.
Tiling annotations are applied to the tissue region... and there is a tradeoff between performance and errors (empty tiles) when selecting a tile size. I found a tile size of 1000 let me run the whole tissue sample without problems, but I struggled to visualize any large areas. Once the areas are generated, the values for each tile annotation are summed and applied to the original annotation, after which the tiles are removed.
This leaves you with one annotation containing area and percentage measurements, which can be exported. If you run this script across multiple slides, you can then run Pete's second data summary script to get it all into a single summary file for the project.
I'll need to alter a few things to get it to work with V1.2 when I get home, as the positive pixel detection method changed a little bit.
micros...@gmail.com
Jul 6, 2018, 10:05:21 PM7/6/18
to QuPath users
And here is the 1.2 version: https://gist.github.com/Svidro/68dd668af64ad91b2f76022015dd8a45#file-psr-positive-pixel-detection-v1-2-groovy
Roughly the same though I didn't bother to calculate the total "red" area.
dhlw...@gmail.com
Jul 19, 2018, 10:03:41 AM7/19/18
to QuPath users
The staining halo is just an artefact of fixation and staining i think. It's not such an issue as I would probably threshold to gain as accurate a representaion as possible without excessive background and then bare in mind that since all tissue within the experimental group exhibit it it becomes a relative non-issue.
Reply all
Reply to author
Forward
0 new messages