noobie here. Need help
80 views
Skip to first unread message

Martin Schmidt
Mar 29, 2015, 10:56:37 AM3/29/15
to plots-spe...@googlegroups.com
Hi
I've crafted a transmission spectrophotometer inspired by the Foldable mini spectrometer. It seems to be working, i just need some questions answered to be able to fine tune it. I hope you can help :)
Firstly, i amde it using a blank DVD-R or DVD+R, not really sure. but one of those 4.7gb ones. I rinced the dvd with denatured alcohol. I've cut a ~3mm rough slit, and taped parallel razors on top of with a slit ~1mm.
I taped the whole thing to an old cell phone cover for easy mounting.
My questions are:
- How narrow should the slit be
- How should i focuse the camera (I.e. i can focuse on the CFL such that i get some quite narrow peak maxima. Doing that, the green peak splits in two, and i get a couple of smaller peaks before the big red peak. I'm not sure wether those features are due to some internal reflections, or they are actual emission peaks from something?). This leads me to my next question.
- The grating is horizontal to my slit, as you can see. But is there a difference wether the grooves in the dvd is pointed towards or away from te incident light? I'd say it should point towards, but i'm not really sure which way that is.
- Camera lighting modes. I think this changes the hue. I have to select either automatic, or "sunlight, cloudy, electrical light" etc...
Warm-white CFL bulb:

Cheers.
Hope you can help =)

Terry Relph-Knight
Mar 30, 2015, 10:51:22 AM3/30/15
to plots-spe...@googlegroups.com
Hi Martin,
Slit widths vary. A wide slit lets in lots of light making for a more sensitive spectrometer while a narrow slit gives better resolution.
Focus is a much debated topic on this forum. Broadly speaking you want to focus to get the sharpest image, the only problem being that any lens tends to have slightly different focal lengths at different wavelengths of light. In a spectrometer the light is of course split into its component wavelengths. In theory that means you might have one portion of the spectrum in better focus than the rest. What makes most sense to me is to have the camera focused on the spectrometer slit, but other opinions say the focus should be at some point beyond the slit. Anyway your spectrum seems pretty good to me. You should be able to see two green peaks (although Spectral Workbench calibration at present only allows for one).
Your spectrum does seem over exposed - I can see a white area in the middle of your reds. Look at http://en.wikipedia.org/wiki/Fluorescent_lamp Scroll down to spectra and look at the first plot for an example.
I prefer to have my grooved side of the DVD-R towards the camera, but it does not seem to make a big difference.
Camera setup makes a considerable difference to the accuracy of your spectrometers amplitude response. If for example you have your colour temperature set for a low temperature the camera will exaggerate the blue end of the spectrum because it is trying to compensate for 'warm' lighting. There is no provision in Spectral Workbench for camera settings nor any agreed method for choosing camera settings. There is at the moment no agreed method for attempting to calibrate the amplitude response of Public Lab spectrometers. There are some great Ideas about how to go about amplitude calibration using 'daylight' halogen lamps with a known response, but no agreed method.
Martin Schmidt
Mar 30, 2015, 4:28:50 PM3/30/15
to plots-spe...@googlegroups.com
Okay.
Today i've made what i'd call the final tweak of my diy spectrometer. Unless i decide to order some grating film, but i doubt it.
When recording the spectrum of leds, i dont seem to get the spectrum i'm supposed to. My led spectrum is comparable to the one other people have recorded, though.
Is it due to different sensitivity towards different colors?
I made the spectrometer in order to be able to measure spectra of different light sources with at least some accuracy, but it doesnt seem to do the job. I've again attached the spectrum ive talked about, but you can also find it on my profile.


Is it in any way better to use the "live recording" vs uploading an image? I think ill test that...
If anyone knows anything, i'd gladly hear :)
Thanks in advance

Jeffrey Warren
Mar 30, 2015, 5:45:13 PM3/30/15
to plots-spe...@googlegroups.com
the live capture has lower resolution, but that may not matter to you if it's well above what you need. It also has a consistent scan line height, which you'd have to manually select with the upload tool.
--
Post to this group at plots-sp...@googlegroups.com
Public Lab mailing lists (http://publiclab.org/lists) are great for discussion, but to get attribution, open source your work, and make it easy for others to find and cite your contributions, please publish your work at http://publiclab.org
---
You received this message because you are subscribed to the Google Groups "plots-spectrometry" group.
To unsubscribe from this group and stop receiving emails from it, send an email to plots-spectrome...@googlegroups.com.
For more options, visit https://groups.google.com/d/optout.
Terry Relph-Knight
Mar 30, 2015, 9:05:40 PM3/30/15
to plots-spe...@googlegroups.com
Hi Martin,
I suspect you may be overexposing, causing saturation in the camera output resulting in a misshaped plot. When capturing in Spectral Workbench switch to the RGB view and check if your curves are clipping against the top of the plot. The sample you show looks very saturated.
There are various solutions to over exposure - move the light source further from the spectrometer, in this case dim the LED you are using as a light source, or use camera control software to reduce the camera gain and exposure. You need to turn off auto white balance, auto exposure and turn sharpness down to zero.
Looking at and adjusting for the raw spectrum can be very misleading. There is tendency to go for lots of very highly saturated colours. Most of the spectral captures you may see on the internet are in fact over exposed. A web cam has a relatively limited dynamic range an easily goes into clipping.
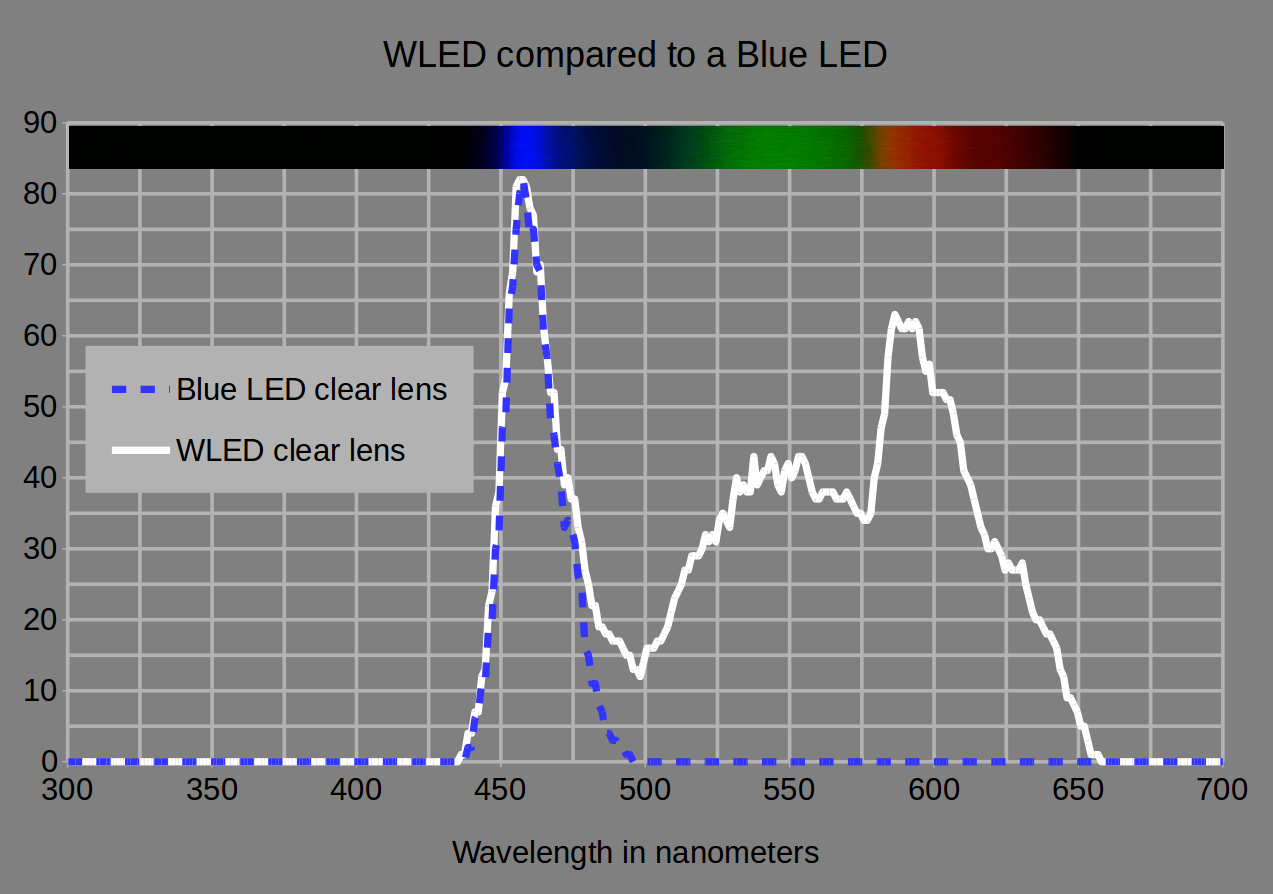
I have attached a twin plot I made of a Blue LED compared to a White LED. The spectrum is of the White LED. You'll notice that the colours are quite muted with an obvious drop almost to black between the blue and yellow light output of the White LED.
As I said in my previous post, you cannot expect pinpoint curve accuracy out of the Public Lab design of spectrometer without some means of amplitude calibration.
I suspect you may be overexposing, causing saturation in the camera output resulting in a misshaped plot. When capturing in Spectral Workbench switch to the RGB view and check if your curves are clipping against the top of the plot. The sample you show looks very saturated.
There are various solutions to over exposure - move the light source further from the spectrometer, in this case dim the LED you are using as a light source, or use camera control software to reduce the camera gain and exposure. You need to turn off auto white balance, auto exposure and turn sharpness down to zero.
Looking at and adjusting for the raw spectrum can be very misleading. There is tendency to go for lots of very highly saturated colours. Most of the spectral captures you may see on the internet are in fact over exposed. A web cam has a relatively limited dynamic range an easily goes into clipping.
I have attached a twin plot I made of a Blue LED compared to a White LED. The spectrum is of the White LED. You'll notice that the colours are quite muted with an obvious drop almost to black between the blue and yellow light output of the White LED.
As I said in my previous post, you cannot expect pinpoint curve accuracy out of the Public Lab design of spectrometer without some means of amplitude calibration.
Martin Schmidt
Mar 31, 2015, 12:31:05 PM3/31/15
to plots-spe...@googlegroups.com
Hi
I tried the following:
Narrowed the slit even more. Cant even insert paper between the razors. I tried on the CFL first to get a good focus, and this sharp spectrum is what i got:

As you can see i have very high resolution.
With the same setup, same distance and same focuse on the led, and i get this:

Here is the corresponding RGB:

They are not even close to being saturated, and i still have this profile. I'm starting to doubt my doubt (double negation intended). Do cheap IKEA led's maybe have such a spectrum? The green seems suppressed, though, and maybe also on my CFL image, if you compare with wikipedia:
Maybe my LG G2 smartphone's color rendering is suppressing green? And there isn't any dye left on the DVD grating, because i cleaned it with ethanol. Maybe the frosty/milky glass of the bulb that incases the LED suppresses green? Maybe i should open a post entitled "LED trouble" or something...
Terry Relph-Knight
Mar 31, 2015, 1:26:52 PM3/31/15
to plots-spe...@googlegroups.com
Well I'd say that looking at the CFL spectrum that is still clipping. The LED spectrum certainly looks like it isn't clipping and the plot is starting to look more sensible. Because of the wide short web presentation Spectral Workbench really flattens out plots. I prefer to save the data as a CSV file, import it into a spreadsheet and plot the graphs myself so I can expand the vertical scale. That said maybe you are looking at a weird LED. I assume it is a White LED? I think you should try a few more good quality, different colour LEDs from different sources.
How about camera software control, are you able to change the settings on your camera?
Sorry I didn't realise you were using the camera in a smartphone. That could well have something to do with it, although I'd be surprised if it specifically suppressed green. the normal problem with phone and web cams is that they have white balance correction which tries to compensate for illumination by increasing or reducing mostly blue gain. Blue dye left on the DVD grating (which you say you don't have) suppresses the red end of the spectrum.
Terry Relph-Knight
Mar 31, 2015, 1:32:13 PM3/31/15
to plots-spe...@googlegroups.com
In fact, Martin, if you re-scale your plot so it is narrower and taller, it starts to look much more like my plot for a white LED. If you can, try saving the data as a CSV file, import it into a spreadsheet and re-plot it, with a narrower taller graph.
Martin Schmidt
Mar 31, 2015, 5:46:50 PM3/31/15
to plots-spe...@googlegroups.com
You're right.
But there's still the odd thing about green. But maybe that's simply the led. It's a warm white e14 base from IKEA. I'll have to check with other leds before i draw conclusions. And you were right with the CFL spectrum. It's clipped. =)
Thanks.
Terry Relph-Knight
Mar 31, 2015, 7:40:28 PM3/31/15
to plots-spe...@googlegroups.com
Since your LED lamp is for domestic lighting I think it all makes sense. My white plot was for a clear lens, 5mm, electronics LED. That type of LED is basically a blue LED with some of the light energy being converted to yellow light by a glowing phosphor next to the blue junction. The plastic lens is clear, there is no extra filtering from a tint in the lens. You will notice that the blue spike from that white LED is almost identical to the plot I made from a pure blue LED.
Domestic lamps are based on this type of LED technology, but they also have an added yellow filter, a tinted plastic layer, covering the LED to block some of the blue light in order to produce a much 'warmer' illumination that approximates the light from incandescent filament lamps. The various lamp types - cool white and warm white are achieved mostly by tweaking this colour filter. The warm white will have the densest tint.
It is probably the effect of this yellow filter blocking some of the blue and some of the green that you are seeing.
Martin Schmidt
Mar 31, 2015, 8:06:29 PM3/31/15
to plots-spe...@googlegroups.com
Interresting!
So my spectrometer might not be broke afterall =)
I have ordered a special kind of light bulb thats on its way to my doorstep. It's 100W of Cree XP-G2. Will be interesting to see if i can get a spectrum similar to what's in their datasheet.
Thanks much for the help :)
Oh and i've been contemtplating something else... have you ever noticed "ecco" peaks after the middle blue peak in CFL's? That is, the first calibration point. I get that sometimes. I think its "intra-groove-reflections" or something. Would a 1000lines per mm sheet be better than a DVD-R? And last question: Would you get better resolution by increasing the distance between the slit and the grating? I'm thinking that individual wavelengths would disperse more, covering a larger area on grating.
--
Post to this group at plots-sp...@googlegroups.com
Public Lab mailing lists (http://publiclab.org/lists) are great for discussion, but to get attribution, open source your work, and make it easy for others to find and cite your contributions, please publish your work at http://publiclab.org
---
You received this message because you are subscribed to a topic in the Google Groups "plots-spectrometry" group.
To unsubscribe from this topic, visit https://groups.google.com/d/topic/plots-spectrometry/ZtLXALzz4Us/unsubscribe.
To unsubscribe from this group and all its topics, send an email to plots-spectrome...@googlegroups.com.
Terry Relph-Knight
Mar 31, 2015, 8:32:17 PM3/31/15
to plots-spe...@googlegroups.com
That's right, I think your spectrometer is probably working as well as can be expected for such a simple design. I have tried 1,000 line film and I don't think there is any real advantage to using it. A DVD-R gives you 1,350 lines.
I would treat the Cree spectral plots as being only a rough guide. A lot of lighting companies feel the need to tidy up and smooth out any plots they publish to make them look nice. I doubt the plots shown in the XP G2 data sheet are plotted directly from spectrometer data. If they are it is a spectrometer with a fairly low resolution.
I would treat the Cree spectral plots as being only a rough guide. A lot of lighting companies feel the need to tidy up and smooth out any plots they publish to make them look nice. I doubt the plots shown in the XP G2 data sheet are plotted directly from spectrometer data. If they are it is a spectrometer with a fairly low resolution.
To unsubscribe from this group and all its topics, send an email to plots-spectrometry+unsub...@googlegroups.com.
Terry Relph-Knight
Mar 31, 2015, 8:57:25 PM3/31/15
to plots-spe...@googlegroups.com
Oh, and your question about slit to grating distance - yes a larger slit to grating distance can increase resolution but, I think it is principally because the slit appears as effectively smaller the farther is from the camera. As far as dispersion goes, the dispersion occurs on the other side of the grating where the light is split into its components wavelengths. Since the dispersed spectrum is spreading out on the camera side of the grating, in theory you should be able to get the visible range of wavelengths to cover a greater width of your camera sensor, and therefore increase resolution by moving the camera away from the grating. On the input side of the grating I believe what you want is a parallel sided beam of light - a collimated beam, not something that is spreading.
Incidentally Spectral Workbench itself quantises data into 640 steps along the horizontal axis and 255 steps along the vertical (in practice there seems to be an error because what you actually get is 257). Even when clipping the plot levels are lower because the R,G and B signals are averaged.
Extra peaks after the middle blue may be due to reflected light inside your spectrometer. They should disappear with lower levels of input light.
On Wednesday, 1 April 2015 01:06:29 UTC+1, Martin Schmidt wrote:
To unsubscribe from this group and all its topics, send an email to plots-spectrometry+unsub...@googlegroups.com.
Martin Schmidt
Apr 1, 2015, 8:50:00 AM4/1/15
to plots-spe...@googlegroups.com
Hi again...
Even some Frauenhofer lines are visible. But the spectrum looks kinda wrong. Again, the green seems suppressed. It more looks like the absorption spectrum of photosynthesis. Can you perhaps analyse the light spectrum of the sky and compare?
We can agree about the spektrum of the big bright bulb in the sky, right?
I've taken loads of pictures, to maximize light input without saturating any of the colours. I more or less get the same image every time, as this image below shows:

The next two images belong to the one with most intensity


Even some Frauenhofer lines are visible. But the spectrum looks kinda wrong. Again, the green seems suppressed. It more looks like the absorption spectrum of photosynthesis. Can you perhaps analyse the light spectrum of the sky and compare?
Cheers =)

Chris Fastie
Apr 1, 2015, 11:58:54 AM4/1/15
to plots-spe...@googlegroups.com
Hi Martin,
Capturing a solar spectrum was a smart test. Your solar spectrum is just like many others at spectral Workbench with the green channel lower that the red or blue. The actual solar spectrum has its peak of intensity around green. Certainly the red end of the spectrum should not be brighter than green. So this is probably an artifact of the camera. The same artifact is present in spectra captured with a Canon PowerShot, so it is not just caused by cheap CMOS sensors.

I'm not sure why cameras process the data to suppress green. There are twice as many green pixels as red or blue, and very deliberate processing is required to make an image that looks realistic to people. Maybe our eyes suppress green (because there is so much of it in the environment) so cameras have to do the same thing.
Chris
Martin Schmidt
Apr 1, 2015, 12:14:25 PM4/1/15
to plots-spe...@googlegroups.com
Thank you, Chris! =)
Maybe someone with some skill should make a script to enhance the green input. I'm thinking that a "sun spectrum" could be a calibration point for every type of camera. The calibration should determine how much the green light should be amplified in order to look like the spectrum of the sun...
Cheers.
--
Post to this group at plots-sp...@googlegroups.com
Public Lab mailing lists (http://publiclab.org/lists) are great for discussion, but to get attribution, open source your work, and make it easy for others to find and cite your contributions, please publish your work at http://publiclab.org
---
You received this message because you are subscribed to a topic in the Google Groups "plots-spectrometry" group.
To unsubscribe from this topic, visit https://groups.google.com/d/topic/plots-spectrometry/ZtLXALzz4Us/unsubscribe.
To unsubscribe from this group and all its topics, send an email to plots-spectrome...@googlegroups.com.
Jeffrey Warren
Apr 1, 2015, 12:40:16 PM4/1/15
to plots-spe...@googlegroups.com
Hi, Martin - indeed, Dave Stoft has proposed a similar sort of intensity calibration (or near-calibration) in his post here: http://publiclab.org/notes/stoft/03-06-2015/plab-3-gain-correction
We'd love to do this and are looking at integrating this into a macro on Spectral Workbench. Any input on moving that process forward is very welcome!
You received this message because you are subscribed to the Google Groups "plots-spectrometry" group.
To unsubscribe from this group and stop receiving emails from it, send an email to plots-spectrome...@googlegroups.com.
Martin Schmidt
Apr 1, 2015, 5:00:22 PM4/1/15
to plots-spe...@googlegroups.com
I'm no expert in this field, or in any, i think. But skimming through this wiki page: http://en.wikipedia.org/wiki/Color_vision, i came to think... if one knew which kind of transformation that had been applied to the "original image" in order to suppress the green to the extent that has been done..maybe it could be reversed. And we wouldn't need to calibrate, but only to figure out what the transformation was...
I havnt got too much time, but i'd recommend someone read that wiki page and looked into chromatic adaptation..
Terry Relph-Knight
Apr 2, 2015, 12:35:08 AM4/2/15
to plots-spe...@googlegroups.com
Sunlight is OK as a rough guide broad spectrum source, but it is far from constant enough for calibration reference. The spectrum of sunlight varies quite a bit during the day and depending on atmospheric conditions.
I don't see any reason why a web or phone cameras green channel should be lower than red or blue. The plots I have made of daylight with two different PL style spectrometers do not have a low green response.
The bayer filters in cameras have more green cells than red or blue because the elements in the eye that sense luminance are mostly sensitive to green. Luminance is used as a visual cue to definition of a scene. But the RGB gains are adjusted usually for a good white balance. If the green channel is permanently low you would expect camera images to look magenta, which they usually don't (although the SanM Tech camera that shipped with Spectrometer 2.0 did have a tendency to magenta when illuminated with daylight - I never managed to find a setting where this camera white balanced properly, although it did cope better with artificial light).
I think the fundamental problem is that there is as yet no recognised method of amplitude calibration for the PL Spectometers. You cannot calibrate a colour device and repeatedly apply a meaningful correction profile unless you first calibrate the hardware (in this case the camera in the spectrometer) to known points. And you cannot do that unless you disable all automatic corrections using camera control software and then manually adjust the controls. If you leave all the automatic functions running the camera will simply try to automatically adapt its output and you never know where you are. Any profile correction will be meaningless. Given that the camera input is a spectrum from a diffraction grating, rather than a 'normal' image, the cameras automatic functions are likely to do some rather odd things.
Martin Schmidt
Apr 2, 2015, 3:55:41 AM4/2/15
to plots-spe...@googlegroups.com
The camera app I'm using happens to give me full control og focuse, zoom, iso, exposure and light setting. The latter though only by selecting different themes, like "sun light", "cloudy" etc.
I have attempted to record spectrums of daylight with all light settings and I so settings. The green suppression is not some controllable camera setting in the app.. I think it's a constant.
I have attempted to record spectrums of daylight with all light settings and I so settings. The green suppression is not some controllable camera setting in the app.. I think it's a constant.
Terry Relph-Knight
Apr 25, 2015, 12:44:26 PM4/25/15
to plots-spe...@googlegroups.com
This is a rather late addition to this thread but - no you are right, cameras do not as a rule have an adjustment called "green suppression". It is certainly odd that you seem to be experiencing this problem.
However it's worth noting that commercial spectrometers do not use a "colour" sensor. The Public Lab style spectrometer uses a web-cam for convenience and low cost and web-cams are "colour" cameras. They process and output their data as three colour channels - red, green and blue so it is clear that if the sensitivity or gain of the green channel happens to be low the output of your spectrometer will be distorted and you will see the green drop out you seem to be experiencing. As you say you probably don't have any control over green channel gain. Often the only software control over colour is for colour temperature which mostly boosts or cuts the blue gain.
However as I said before, if the lack of green is a problem in the camera it should be obvious if you point the camera at a "real world" scene (rather than the spectrum form a diffraction grating). For example an outdoor scene including some grass. If the camera really has a problem with its green channel the grass will look purple.

Tom Taylor
Apr 26, 2015, 12:53:31 PM4/26/15
to plots-spe...@googlegroups.com
Hi All, the spectrometer isn't my core interest, but I was seeing a similar green suppression effect with my NIR converted Canon, as detailed in my research post about a year ago, where I also speculated about the reasons. As suggested by the difference between my raw image and the demosaiced version, it looks like this suppression of the green takes place in the post-capture image processing. The ability to use the raw color channels let's me get around this. If all you have to work with is a jpeg image, although you can (and should) contrast stretch in the green channel to calibrate your spectral intensity, you won't be able to recapture the intensity resolution (bit-depth) that you lost in the processing chain raw image->green suppression->requantize-as-8bit. If you want that intensity resolution in the mid-wavelength region, I'm seeing some of the raspberry pi cam enthusiasts talking about raw image capture, and they're almost as cheap as a webcam.
Terry Relph-Knight
Apr 27, 2015, 6:58:21 AM4/27/15
to plots-spe...@googlegroups.com
Hi Tom,
I wonder about this, the thing that often isn't clearly explained is why the Bayer filter mosaic pattern (and as far as I know other camera filter structures) has twice as many green filtered pixels as red or blue. As I understand it it is because the human visual system is at its highest resolution in the green. Using twice as many green pixels improves perceived image resolution. However as far as I can tell this also means that the raw output from the sensor must have a higher green signal. This presumably is reduced to balance with the red and blue when the raw data is de-mosaiced. I guess it also means that if you use the raw data you have to take this into account and reduce the green levels accordingly. I imagine that most photo image processing software does this automatically if you work with raw images.
In this sense for anything other than raw data output, the green channel is usually reduced by the de-mosaic algorithm in camera, but only to the point where the green balances correctly with the red and blue in the final image.
It almost sounds like the work flow Martin is following to capture his spectrometer images is perhaps de-mosaic processing image data that has already been de-mosaiced. I guess this would result in green 'suppression'. Again I would have thought that using the camera to capture a 'normal' image, to take a photo if you will, of any day to day scene, and to import it and display it on screen, would reveal if and where this green reduction is taking place.

Robert Dyer
Apr 27, 2015, 2:24:02 PM4/27/15
to plots-spe...@googlegroups.com
I don't know what you guys think of Wikipedia, but here's their article on Bayer Filters.
From: "Terry Relph-Knight" <terry...@gmail.com>
Sent: Monday, April 27, 2015 3:58 AM
Sent: Monday, April 27, 2015 3:58 AM
--
Post to this group at plots-sp...@googlegroups.com
Public Lab mailing lists (http://publiclab.org/lists) are great for discussion, but to get attribution, open source your work, and make it easy for others to find and cite your contributions, please publish your work at http://publiclab.org
---
You received this message because you are subscribed to the Google Groups "plots-spectrometry" group.
To unsubscribe from this group and stop receiving emails from it, send an email to plots-spectrome...@googlegroups.com.
Reply all
Reply to author
Forward
0 new messages