How To Obtain Transmittance/ Absorbance Spectra a step by step guide...
28 views
Skip to first unread message

David haffner sr
Jul 15, 2016, 4:58:58 PM7/15/16
to plots-spectrometry
I put together this wiki page as a guide for anyone interested in how you can obtain absorption spectra, Dr. Menges originally explained this in the google groups, so I went ahead and conducted the step by step procedure and posted the results here
Dave H

Dave Stoft
Jul 16, 2016, 2:17:13 AM7/16/16
to plots-spectrometry
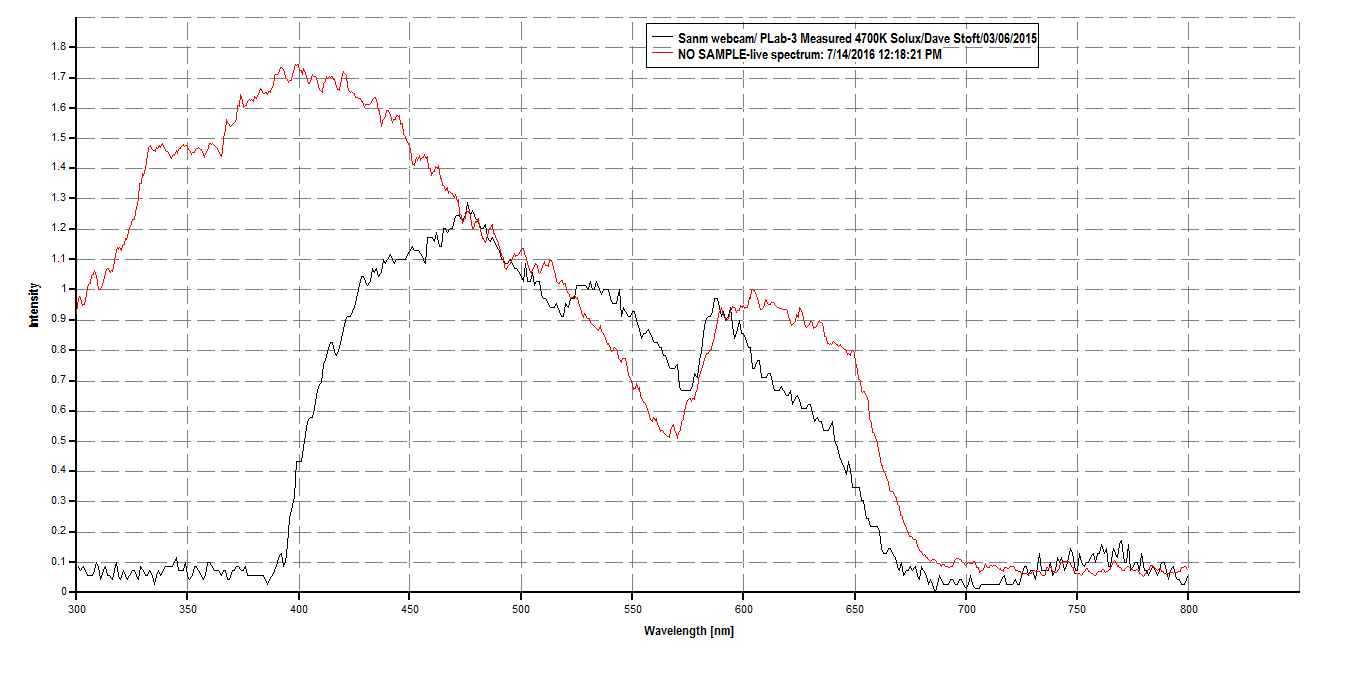
Two questions: 1) why do all of the plots have different X axes ranges and 2) can the unusual 'dip' in the "no sample" Solux plot be explained?
David haffner sr
Jul 16, 2016, 4:07:04 AM7/16/16
to plots-spe...@googlegroups.com
hey Dave, yeah, the X axes are easy to explain, all the plots start at the same point before any processing but the way Dr.Menges designed the software, there is no "undo" button, what I mean is, when I preform a division the plots have to match perfectly at both points, if they don't the final result goes ka-blewy and a big mess shows up on screen. So sometimes I have to cutoff part of the spectrum in order to get the wave forms to fit each other at both ends and the division goes as planned.
I always work from a copy and keep the original raw data files intact, just in case something disasterous happens. This does not in any way change the validity of the results though, now as far as the "dip," in the no-sample, I suspect it might have something to do with the DVD piece, let me explain my theory on that, (please indulge me on this,) I'm not sure if its the brand or manufacturing process but even removing the final violet layer from it still leaves a layer on the flip side which does not come off.
I have tried and it ruins the DVD piece, it seems to have no effect for fluorescence measurements but perhaps this layer is contributing a small amount of absorption to the data when the light is passing through?
That's why I presented the plot showing all three wave forms starting at 300nm and ending at 800nm, I can select wavelength range from spekwin32 when capturing spectra, also it has the capability of not only capturing the horizontal pixels but the vertical pixels also.
On Sat, Jul 16, 2016 at 2:17 AM, Dave Stoft <dst...@gmail.com> wrote:
Two questions: 1) why do all of the plots have different X axes ranges and 2) can the unusual 'dip' in the "no sample" Solux plot be explained?
--
Post to this group at plots-sp...@googlegroups.com
Public Lab mailing lists (http://publiclab.org/lists) are great for discussion, but to get attribution, open source your work, and make it easy for others to find and cite your contributions, please publish your work at http://publiclab.org
---
You received this message because you are subscribed to a topic in the Google Groups "plots-spectrometry" group.
To unsubscribe from this topic, visit https://groups.google.com/d/topic/plots-spectrometry/UEkgXfw0YTA/unsubscribe.
To unsubscribe from this group and all its topics, send an email to plots-spectrome...@googlegroups.com.
For more options, visit https://groups.google.com/d/optout.
David haffner sr
Jul 16, 2016, 11:18:37 AM7/16/16
to plots-spe...@googlegroups.com
Hey Dave, I just compared your solux 4700K plot to mine and here is what they look like, your's has the same "dip."
On Sat, Jul 16, 2016 at 2:17 AM, Dave Stoft <dst...@gmail.com> wrote:
Two questions: 1) why do all of the plots have different X axes ranges and 2) can the unusual 'dip' in the "no sample" Solux plot be explained?
--
Dave Stoft
Jul 16, 2016, 2:43:55 PM7/16/16
to plots-spectrometry
Ok, so it seem that Spekwin doesn't preserve the X axes over mat operations? If so, that is very unfortunate as when plotting curves through processing steps it is very necessary to plot them with the same X axes values. No, not because the data is incorrect, but because plots are visual devices and humans find it difficult to automatically visually scale and re-size plots when comparing their characteristics. So, investigating how to either correct this plotting problem or work around the defect would be a good thing.
Interesting plot comparison for the Solux. I doubt the 570-575 notch is related to any residual film with tends to be blue to purple in color (shorter wavelength). However, since the two plots are relative, what is different is a peaking at 400 instead of 475 and 620 instead of 580. I'd guess these differences, plus the notch at 570 instead of 575, is evidence of the difference in RGGB filtering curves between the two camera types. Your camera appears to have a B filter (and maybe raw sensitivity) that is more tuned to UV, the center wavelength difference between G and R is a bit larger (so shifted, deeper notch) and much less R sensitivity. Was the IR filter removed? If not, that might account for the more dramatic sensitivity difference between 400 and 700 (i.e. if the plot scaling of my 475 peak were equal to your 400 peak, your curve would appear to 'roll-off' faster from 450 to 650). It's just good to understand the root cause behind differences when attempting to measure the same source so as to know the implications for other measurements. The Sanm camera is not a great camera, but its measured Solux response does match with it's expected performance. Given the smooth Solux source spectra, I'm not yet able to explain the response of your camera. You might plot (with the same X axes) the Solux responses of (no sample container) vs (sample container w/o sample) -- i.e. is the container having some effect?
Interesting plot comparison for the Solux. I doubt the 570-575 notch is related to any residual film with tends to be blue to purple in color (shorter wavelength). However, since the two plots are relative, what is different is a peaking at 400 instead of 475 and 620 instead of 580. I'd guess these differences, plus the notch at 570 instead of 575, is evidence of the difference in RGGB filtering curves between the two camera types. Your camera appears to have a B filter (and maybe raw sensitivity) that is more tuned to UV, the center wavelength difference between G and R is a bit larger (so shifted, deeper notch) and much less R sensitivity. Was the IR filter removed? If not, that might account for the more dramatic sensitivity difference between 400 and 700 (i.e. if the plot scaling of my 475 peak were equal to your 400 peak, your curve would appear to 'roll-off' faster from 450 to 650). It's just good to understand the root cause behind differences when attempting to measure the same source so as to know the implications for other measurements. The Sanm camera is not a great camera, but its measured Solux response does match with it's expected performance. Given the smooth Solux source spectra, I'm not yet able to explain the response of your camera. You might plot (with the same X axes) the Solux responses of (no sample container) vs (sample container w/o sample) -- i.e. is the container having some effect?
David haffner sr
Jul 16, 2016, 3:07:03 PM7/16/16
to plots-spe...@googlegroups.com
Hey Dave, thanks for replying, yeas I removed the IR filter from this webcam, and you are right, Dr.Menges hasn't included the X axes on the hardware control program yet...still waiting. I noticed the deeper notch also between yours and mine.I'm running a series of tests today because I replaced the DVD piece with one that I took alot of time with trying to get all that purple layer off, it looks pretty good, the problem is keeping the the lamp and spectrometer in line. I think I got it set were its aligned and I won't bump into it, like I have done before, I like the way spekwin32 lets me set the cross section on the capture screen, once it is set it stays in place until you close it down, it would be nice if plab would let you do the same thing.
That's a big problem I have when I'm trying to capture spectra from workbench, the cross section line always goes back to default. I have tried to place a mark on my monitor screen, but it's still not very precise.
I am going to see if the container is having a slight affect also, I thought of that too, it can't be much but every little bit helps!
On Sat, Jul 16, 2016 at 2:43 PM, Dave Stoft <dst...@gmail.com> wrote:
Ok, so it seem that Spekwin doesn't preserve the X axes over mat operations? If so, that is very unfortunate as when plotting curves through processing steps it is very necessary to plot them with the same X axes values. No, not because the data is incorrect, but because plots are visual devices and humans find it difficult to automatically visually scale and re-size plots when comparing their characteristics. So, investigating how to either correct this plotting problem or work around the defect would be a good thing.
Interesting plot comparison for the Solux. I doubt the 570-575 notch is related to any residual film with tends to be blue to purple in color (shorter wavelength). However, since the two plots are relative, what is different is a peaking at 400 instead of 475 and 620 instead of 580. I'd guess these differences, plus the notch at 570 instead of 575, is evidence of the difference in RGGB filtering curves between the two camera types. Your camera appears to have a B filter (and maybe raw sensitivity) that is more tuned to UV, the center wavelength difference between G and R is a bit larger (so shifted, deeper notch) and much less R sensitivity. Was the IR filter removed? If not, that might account for the more dramatic sensitivity difference between 400 and 700 (i.e. if the plot scaling of my 475 peak were equal to your 400 peak, your curve would appear to 'roll-off' faster from 450 to 650). It's just good to understand the root cause behind differences when attempting to measure the same source so as to know the implications for other measurements. The Sanm camera is not a great camera, but its measured Solux response does match with it's expected performance. Given the smooth Solux source spectra, I'm not yet able to explain the response of your camera. You might plot (with the same X axes) the Solux responses of (no sample container) vs (sample container w/o sample) -- i.e. is the container having some effect?

Friedrich Menges
Jul 16, 2016, 6:48:50 PM7/16/16
to plots-spectrometry
Please, before speculating about malfunctions of the software, you should first know what you are talking about. There is certainly no plotting problem with Spekwin32, sometimes it might be just an operator problem, right?
I fully appreciate David's work, he is pushing harder than perhaps anyone else. However, he still did it wrong in several ways. I will explain in detail where it went wrong and will show how to do it right as soon as I find time for it. However, I want to make a living from my spectroscopy software, so this is a higher priority, understandably...
I fully appreciate David's work, he is pushing harder than perhaps anyone else. However, he still did it wrong in several ways. I will explain in detail where it went wrong and will show how to do it right as soon as I find time for it. However, I want to make a living from my spectroscopy software, so this is a higher priority, understandably...
David haffner sr
Jul 17, 2016, 8:14:49 AM7/17/16
to plots-spe...@googlegroups.com
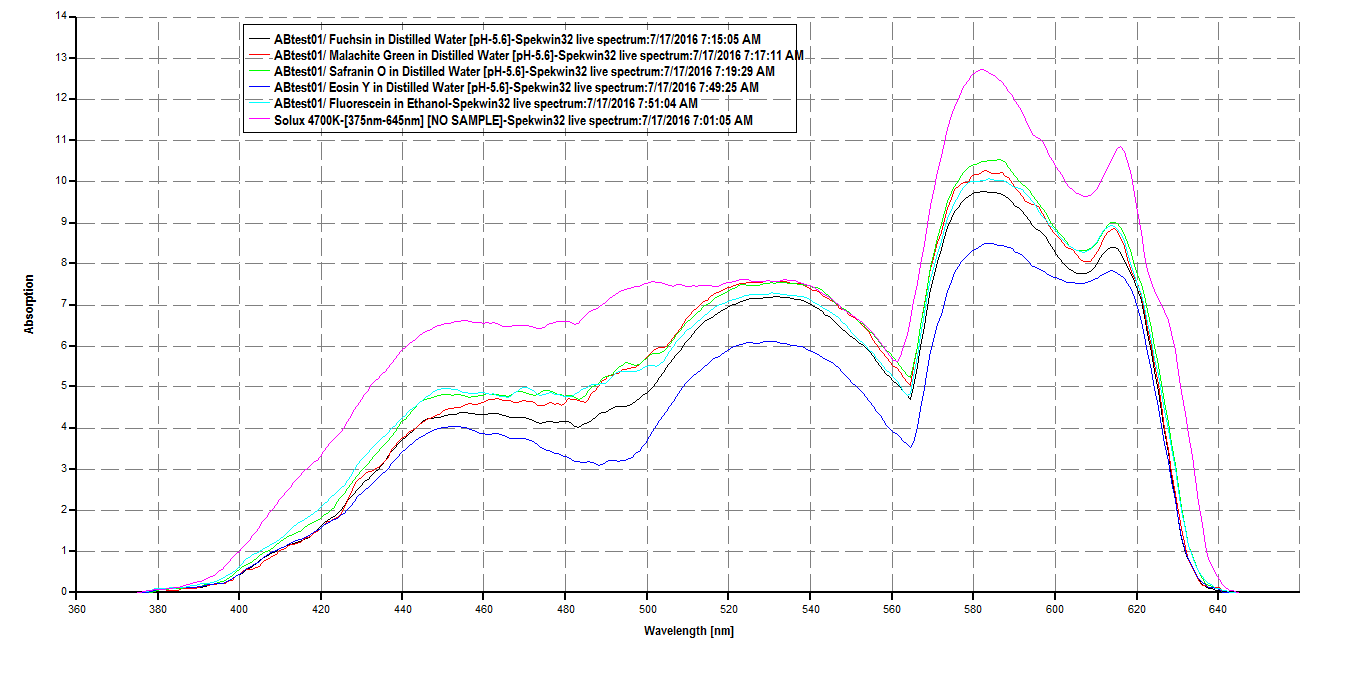
@stoft Hey Dave, I figured out what I did wrong, on the "set wavelength range" menu in the spekwin32 capture window, I had it set for 400nm to 650nm, thinking I had to stay within the parameters of the webcam's capailities, but I re-examined what you were saying about the comparison plots of your solux scan and mine, and went ahead and set my wavelength range from 360nm - 809nm and the X axes all lined up just fine.
I did a scan of 5 different biological dyes and here is what it all looks like:
On Sat, Jul 16, 2016 at 2:17 AM, Dave Stoft <dst...@gmail.com> wrote:
Two questions: 1) why do all of the plots have different X axes ranges and 2) can the unusual 'dip' in the "no sample" Solux plot be explained?
--

Jeffrey Warren
Jul 18, 2016, 10:55:49 AM7/18/16
to plots-spe...@googlegroups.com
I just wanted to applaud Dave Haffner's attempts to make processes like absorption/transmission more accessible to a wider audience. I'll look through the wiki page shortly and offer some input!
You received this message because you are subscribed to the Google Groups "plots-spectrometry" group.
To unsubscribe from this group and stop receiving emails from it, send an email to plots-spectrome...@googlegroups.com.
Jeffrey Warren
Jul 18, 2016, 10:57:36 AM7/18/16
to plots-spe...@googlegroups.com
Re: notches -- in theory, for a given camera, gain correction should remove any notches caused by the junction (in overlap) between color channels, right?
Jeffrey Warren
Jul 18, 2016, 11:06:42 AM7/18/16
to plots-spe...@googlegroups.com
Also, I wonder if a set of "instructables-style" photos of the setup, or diagrams of the light, the spectrometer, and the sample, could help to explain the overall setup and sequence to folks.
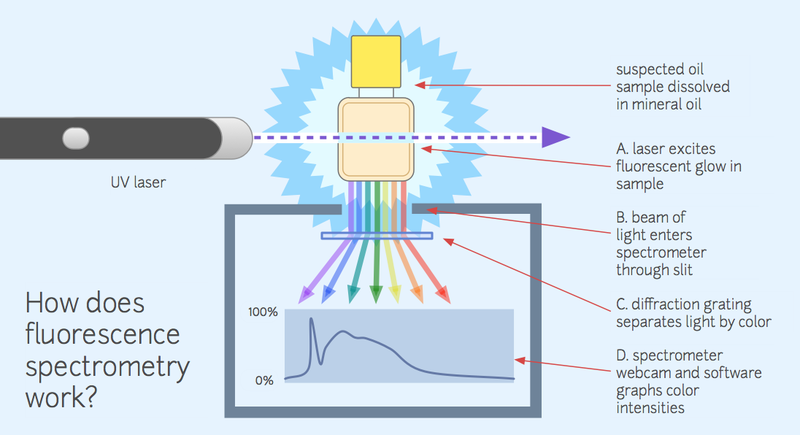
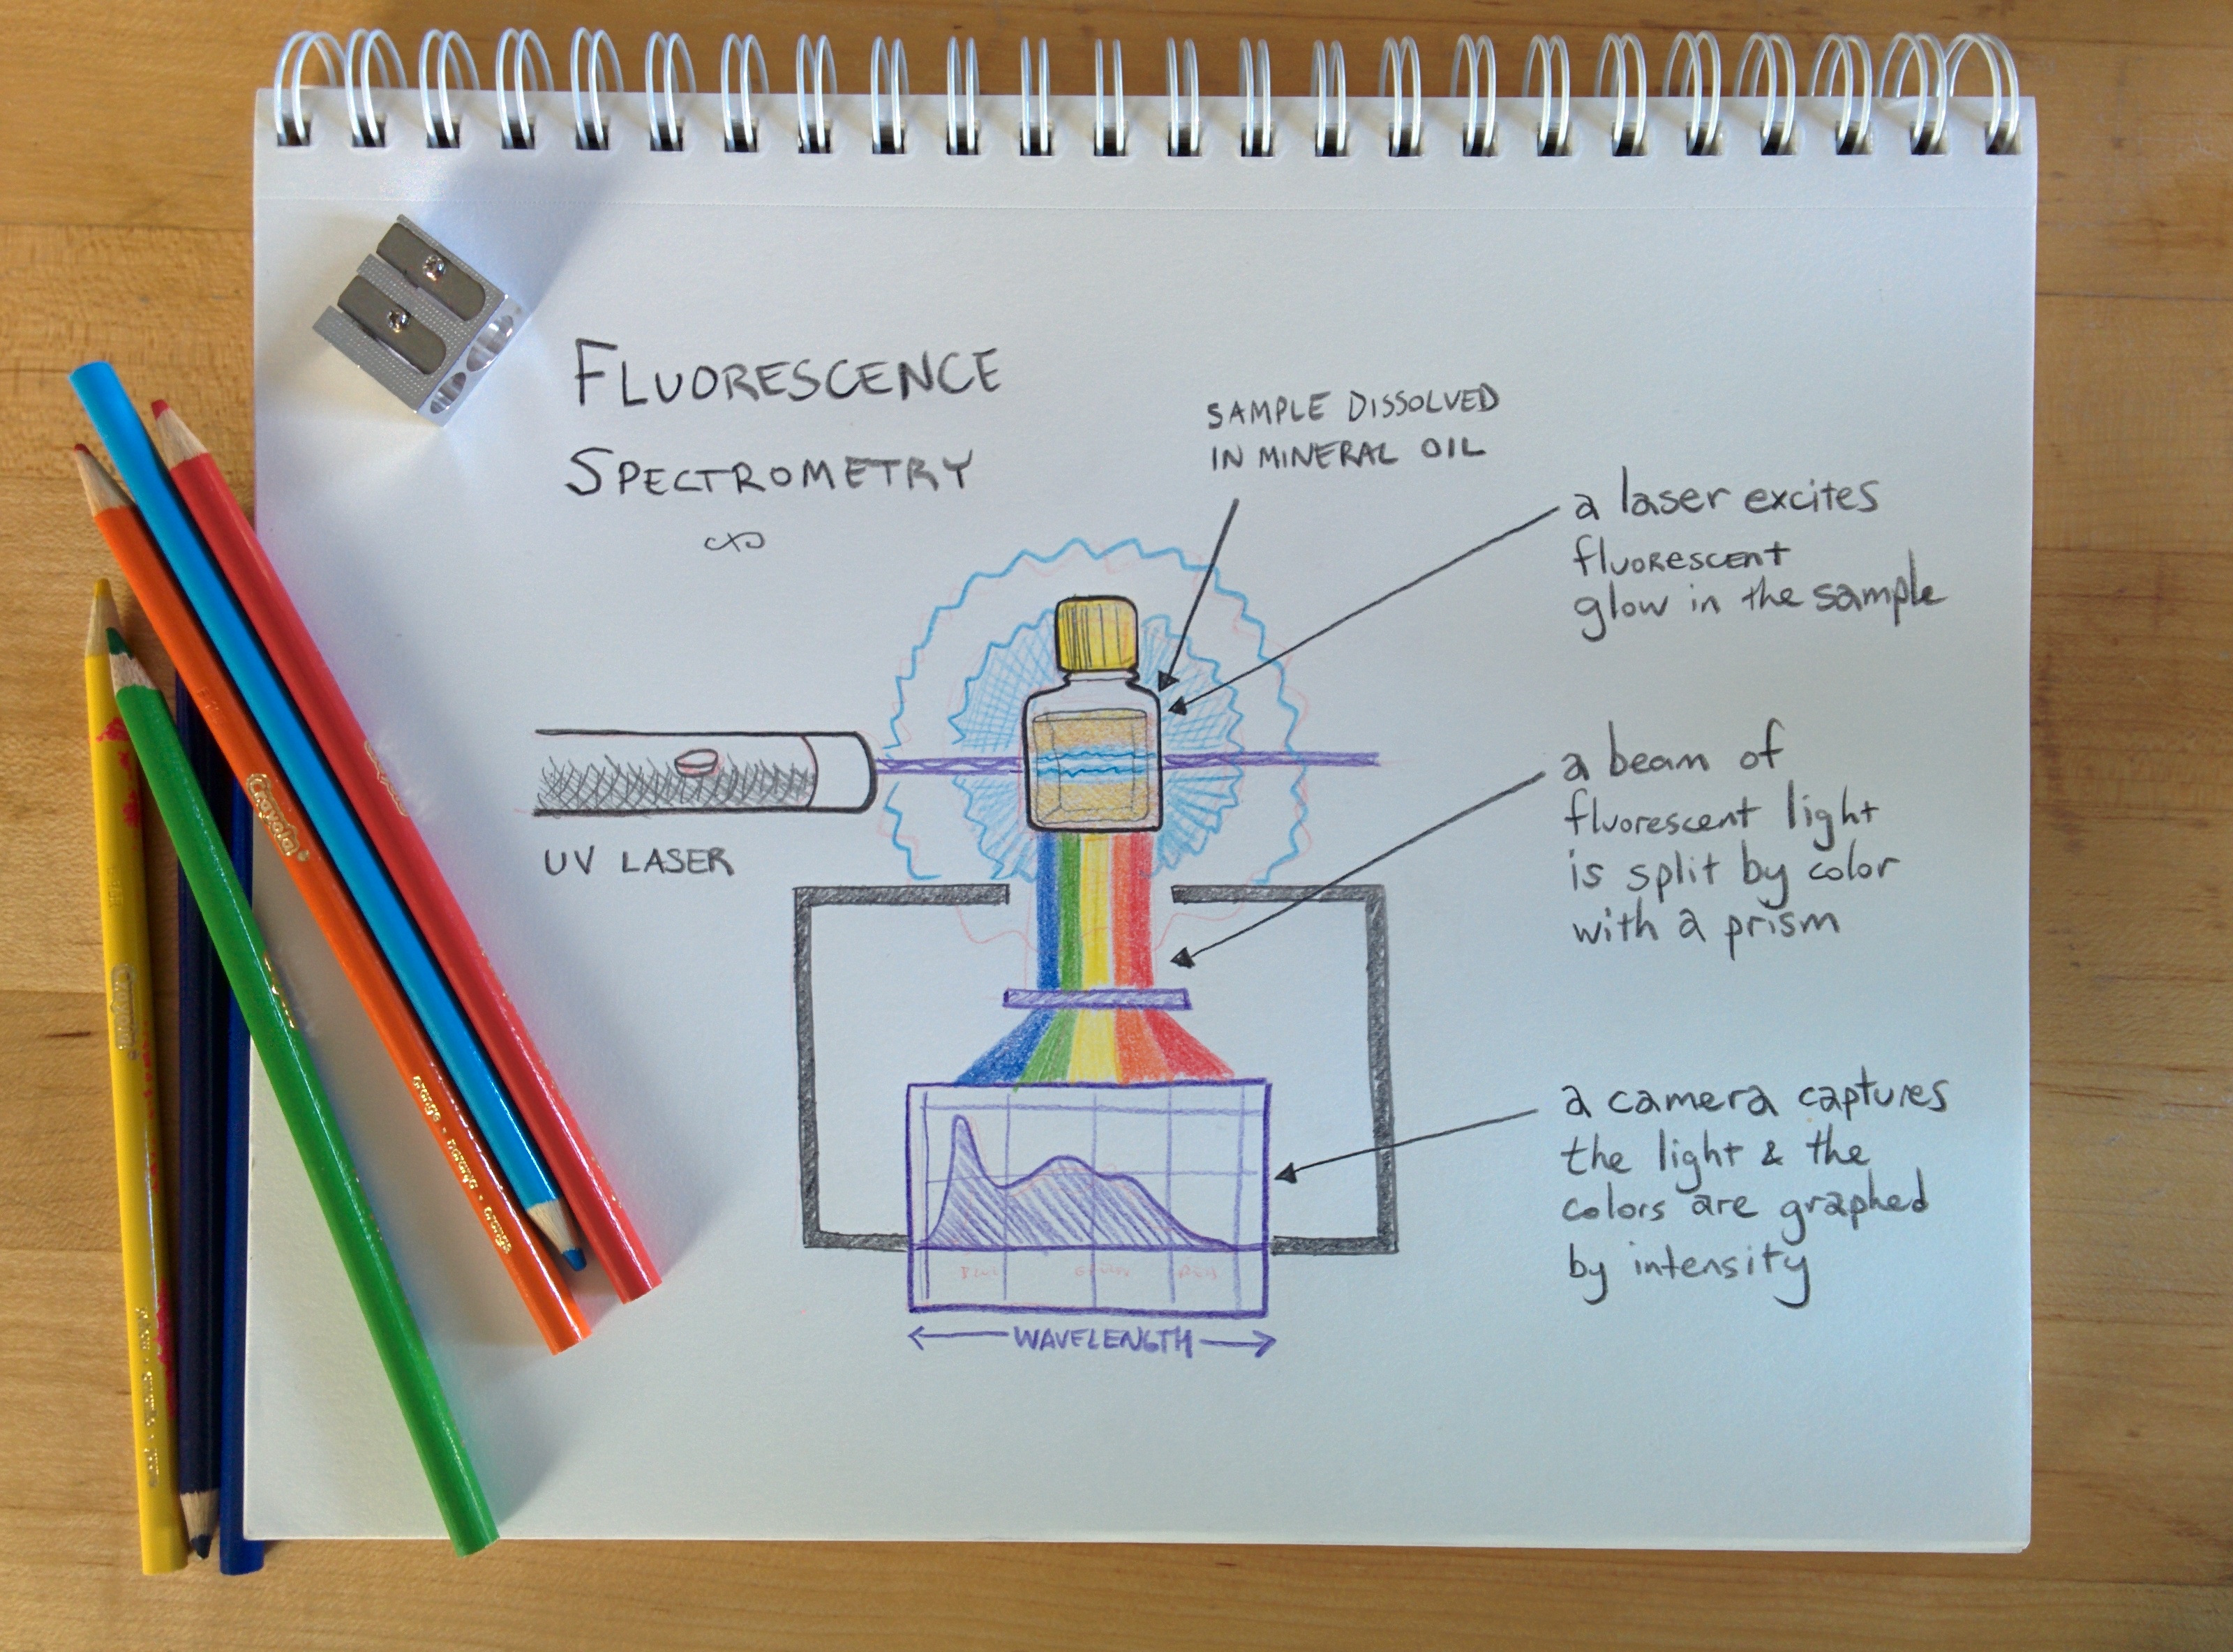
Diagrams work fine even if hand-drawn -- this diagram (on the "spectrometer" wiki page):
Was originally hand-drawn. I'd be happy to help break this out further using easy-to-follow diagrams -- and we can reach out to the main public lab list to ask if any illustrators or designers are interested in helping out, too. Dave Stoft makes a good point that we can't underestimate the importance of clear and thorough presentation of the work.
David haffner sr
Jul 18, 2016, 12:14:41 PM7/18/16
to plots-spe...@googlegroups.com
Hey Jeff, well I just learned that "gain correction" is not always appropriate for every situation, only IF, the two spectra's are identical.
Reply all
Reply to author
Forward
0 new messages