Converting CSV files on Windows 7 on up with commas instead of decimals
20 views
Skip to first unread message

David haffner sr
Apr 27, 2016, 11:35:57 AM4/27/16
to plots-spectrometry
I posted a new research note, more of a tutorial, on how to get your csv files to convert to comma's instead of decimals in windows so they can be uploaded on the new csv (beta) uploader for raw data and such.
thanks and please check it out!
Dave H
David haffner sr
Apr 27, 2016, 11:41:56 AM4/27/16
to plots-spectrometry
I also put them in a set here they are:

Jeffrey Warren
Apr 27, 2016, 2:05:00 PM4/27/16
to plots-spe...@googlegroups.com
Hi, Dave - so, were some of those with a PL spectrometer and others with a lab spec? I think i remember you said you'd done that comparison in this note: https://publiclab.org/notes/dhaffnersr/04-20-2016/plab-spectrometer-version-2-5-vs-spex-fluoromax
I'd love to see scans from the two devices directly compared!
--
Post to this group at plots-sp...@googlegroups.com
Public Lab mailing lists (http://publiclab.org/lists) are great for discussion, but to get attribution, open source your work, and make it easy for others to find and cite your contributions, please publish your work at http://publiclab.org
---
You received this message because you are subscribed to the Google Groups "plots-spectrometry" group.
To unsubscribe from this group and stop receiving emails from it, send an email to plots-spectrome...@googlegroups.com.
For more options, visit https://groups.google.com/d/optout.
David haffner sr
Apr 27, 2016, 2:30:47 PM4/27/16
to plots-spe...@googlegroups.com
Ha ha, I wish I had the Spexfluoromax, no man, I had to use the raw data which is available at the website were the initial scans ans research were done, so I tried to replicate their procedures as close as I could come with the Plab spectrometer. My point with the comparison is to show that with a homemade piece of equipment that is well constructed and modified correctly, one can achieve professional results.
You received this message because you are subscribed to a topic in the Google Groups "plots-spectrometry" group.
To unsubscribe from this topic, visit https://groups.google.com/d/topic/plots-spectrometry/-RoU842gMXc/unsubscribe.
To unsubscribe from this group and all its topics, send an email to plots-spectrome...@googlegroups.com.
Jeffrey Warren
Apr 27, 2016, 3:26:24 PM4/27/16
to plots-spe...@googlegroups.com
> the raw data which is available at the website
Oh, but sorry, is there raw data available somewhere that we could upload? If not no worries, I just misunderstood.

Friedrich Menges
Apr 27, 2016, 3:46:20 PM4/27/16
to plots-spectrometry
Hi there,
I suggested to Dave to have a look at: http://omlc.org/spectra/PhotochemCAD/class.html
There are absorbance and fluorescence spectra downloadable as ASCII files for 100+ fluorescent compounds. Amongst them also some fluorescent aromatic hydrocarbons (the fluoresceing content of crude oil, actually), amino acids, nucelic acids and some chlorophylls. These spectra are "true spectra", which means all instrument related distortions have bee corrected for and therefore are useful references for comparison!
Have a good time,
Friedrich
Am Mittwoch, 27. April 2016 21:26:24 UTC+2 schrieb Jeffrey Warren:
> the raw data which is available at the websiteOh, but sorry, is there raw data available somewhere that we could upload? If not no worries, I just misunderstood.
On Wed, Apr 27, 2016 at 2:30 PM, David haffner sr <dhaff...@gmail.com> wrote:
Ha ha, I wish I had the Spexfluoromax, no man, I had to use the raw data which is available at the website were the initial scans ans research were done, so I tried to replicate their procedures as close as I could come with the Plab spectrometer. My point with the comparison is to show that with a homemade piece of equipment that is well constructed and modified correctly, one can achieve professional results.
On Wed, Apr 27, 2016 at 2:04 PM, Jeffrey Warren <je...@publiclab.org> wrote:
Hi, Dave - so, were some of those with a PL spectrometer and others with a lab spec? I think i remember you said you'd done that comparison in this note: https://publiclab.org/notes/dhaffnersr/04-20-2016/plab-spectrometer-version-2-5-vs-spex-fluoromaxI'd love to see scans from the two devices directly compared!
On Wed, Apr 27, 2016 at 11:41 AM, David haffner sr <dhaff...@gmail.com> wrote:
I also put them in a set here they are:
On Wednesday, April 27, 2016 at 11:35:57 AM UTC-4, David haffner sr wrote:I posted a new research note, more of a tutorial, on how to get your csv files to convert to comma's instead of decimals in windows so they can be uploaded on the new csv (beta) uploader for raw data and such.
thanks and please check it out!
Dave H
--
Post to this group at plots-sp...@googlegroups.com
Public Lab mailing lists (http://publiclab.org/lists) are great for discussion, but to get attribution, open source your work, and make it easy for others to find and cite your contributions, please publish your work at http://publiclab.org
---
You received this message because you are subscribed to the Google Groups "plots-spectrometry" group.
To unsubscribe from this group and stop receiving emails from it, send an email to plots-spectrometry+unsub...@googlegroups.com.
You received this message because you are subscribed to a topic in the Google Groups "plots-spectrometry" group.--
Post to this group at plots-sp...@googlegroups.com
Public Lab mailing lists (http://publiclab.org/lists) are great for discussion, but to get attribution, open source your work, and make it easy for others to find and cite your contributions, please publish your work at http://publiclab.org
---
To unsubscribe from this topic, visit https://groups.google.com/d/topic/plots-spectrometry/-RoU842gMXc/unsubscribe.
To unsubscribe from this group and all its topics, send an email to plots-spectrometry+unsub...@googlegroups.com.
For more options, visit https://groups.google.com/d/optout.
--
Post to this group at plots-sp...@googlegroups.com
Public Lab mailing lists (http://publiclab.org/lists) are great for discussion, but to get attribution, open source your work, and make it easy for others to find and cite your contributions, please publish your work at http://publiclab.org
---
You received this message because you are subscribed to the Google Groups "plots-spectrometry" group.
To unsubscribe from this group and stop receiving emails from it, send an email to plots-spectrometry+unsub...@googlegroups.com.
Friedrich Menges
Apr 27, 2016, 3:47:53 PM4/27/16
to plots-spectrometry, je...@publiclab.org
Hi there,
I suggested to Dave to have a look at: http://omlc.org/spectra/PhotochemCAD/class.html
There are absorbance and fluorescence spectra downloadable as ASCII files for 100+ fluorescent compounds. Amongst them also some fluorescent aromatic hydrocarbons (the fluoresceing content of crude oil, actually), amino acids, nucelic acids and some chlorophylls. These spectra are "true spectra", which means all instrument related distortions have bee corrected for and therefore are useful references for comparison!
Have a good time,
Friedrich
Am Mittwoch, 27. April 2016 21:26:24 UTC+2 schrieb Jeffrey Warren:
> the raw data which is available at the websiteOh, but sorry, is there raw data available somewhere that we could upload? If not no worries, I just misunderstood.
On Wed, Apr 27, 2016 at 2:30 PM, David haffner sr <dhaff...@gmail.com> wrote:
Ha ha, I wish I had the Spexfluoromax, no man, I had to use the raw data which is available at the website were the initial scans ans research were done, so I tried to replicate their procedures as close as I could come with the Plab spectrometer. My point with the comparison is to show that with a homemade piece of equipment that is well constructed and modified correctly, one can achieve professional results.
On Wed, Apr 27, 2016 at 2:04 PM, Jeffrey Warren <je...@publiclab.org> wrote:
Hi, Dave - so, were some of those with a PL spectrometer and others with a lab spec? I think i remember you said you'd done that comparison in this note: https://publiclab.org/notes/dhaffnersr/04-20-2016/plab-spectrometer-version-2-5-vs-spex-fluoromaxI'd love to see scans from the two devices directly compared!
On Wed, Apr 27, 2016 at 11:41 AM, David haffner sr <dhaff...@gmail.com> wrote:
I also put them in a set here they are:
On Wednesday, April 27, 2016 at 11:35:57 AM UTC-4, David haffner sr wrote:I posted a new research note, more of a tutorial, on how to get your csv files to convert to comma's instead of decimals in windows so they can be uploaded on the new csv (beta) uploader for raw data and such.
thanks and please check it out!
Dave H
--
Post to this group at plots-sp...@googlegroups.com
Public Lab mailing lists (http://publiclab.org/lists) are great for discussion, but to get attribution, open source your work, and make it easy for others to find and cite your contributions, please publish your work at http://publiclab.org
---
You received this message because you are subscribed to the Google Groups "plots-spectrometry" group.
To unsubscribe from this group and stop receiving emails from it, send an email to plots-spectrometry+unsub...@googlegroups.com.
You received this message because you are subscribed to a topic in the Google Groups "plots-spectrometry" group.--
Post to this group at plots-sp...@googlegroups.com
Public Lab mailing lists (http://publiclab.org/lists) are great for discussion, but to get attribution, open source your work, and make it easy for others to find and cite your contributions, please publish your work at http://publiclab.org
---
To unsubscribe from this topic, visit https://groups.google.com/d/topic/plots-spectrometry/-RoU842gMXc/unsubscribe.
To unsubscribe from this group and all its topics, send an email to plots-spectrometry+unsub...@googlegroups.com.
For more options, visit https://groups.google.com/d/optout.
--
Post to this group at plots-sp...@googlegroups.com
Public Lab mailing lists (http://publiclab.org/lists) are great for discussion, but to get attribution, open source your work, and make it easy for others to find and cite your contributions, please publish your work at http://publiclab.org
---
You received this message because you are subscribed to the Google Groups "plots-spectrometry" group.
To unsubscribe from this group and stop receiving emails from it, send an email to plots-spectrometry+unsub...@googlegroups.com.
David haffner sr
Apr 27, 2016, 5:21:34 PM4/27/16
to plots-spe...@googlegroups.com
Hey Friedrich! Thanks for explaining that better than I did! That was an excellent reference, I use it very often.
Dave H
To unsubscribe from this group and stop receiving emails from it, send an email to plots-spectrome...@googlegroups.com.
For more options, visit https://groups.google.com/d/optout.
--
Post to this group at plots-sp...@googlegroups.com
Public Lab mailing lists (http://publiclab.org/lists) are great for discussion, but to get attribution, open source your work, and make it easy for others to find and cite your contributions, please publish your work at http://publiclab.org
---
You received this message because you are subscribed to a topic in the Google Groups "plots-spectrometry" group.
To unsubscribe from this topic, visit https://groups.google.com/d/topic/plots-spectrometry/-RoU842gMXc/unsubscribe.
To unsubscribe from this group and all its topics, send an email to plots-spectrome...@googlegroups.com.
For more options, visit https://groups.google.com/d/optout.
--
Post to this group at plots-sp...@googlegroups.com
Public Lab mailing lists (http://publiclab.org/lists) are great for discussion, but to get attribution, open source your work, and make it easy for others to find and cite your contributions, please publish your work at http://publiclab.org
---
You received this message because you are subscribed to the Google Groups "plots-spectrometry" group.
To unsubscribe from this group and stop receiving emails from it, send an email to plots-spectrome...@googlegroups.com.
For more options, visit https://groups.google.com/d/optout.
--
Post to this group at plots-sp...@googlegroups.com
Public Lab mailing lists (http://publiclab.org/lists) are great for discussion, but to get attribution, open source your work, and make it easy for others to find and cite your contributions, please publish your work at http://publiclab.org
---
You received this message because you are subscribed to a topic in the Google Groups "plots-spectrometry" group.
To unsubscribe from this topic, visit https://groups.google.com/d/topic/plots-spectrometry/-RoU842gMXc/unsubscribe.
To unsubscribe from this group and all its topics, send an email to plots-spectrome...@googlegroups.com.
Jeffrey Warren
May 6, 2016, 5:44:43 PM5/6/16
to plots-spe...@googlegroups.com, stu williams
Just bumping this thread back up again because I made some improvements to the CSV uploading and it now supports TSV (tab-separated value) uploading, including ignoring commented-out lines (as of v0.0.12 of SpectralWorkbench.js).
This means you can more easily upload the data files provided by many spectrometers, such as those linked to by Friedrich from the Oregon Medical Laser Center.
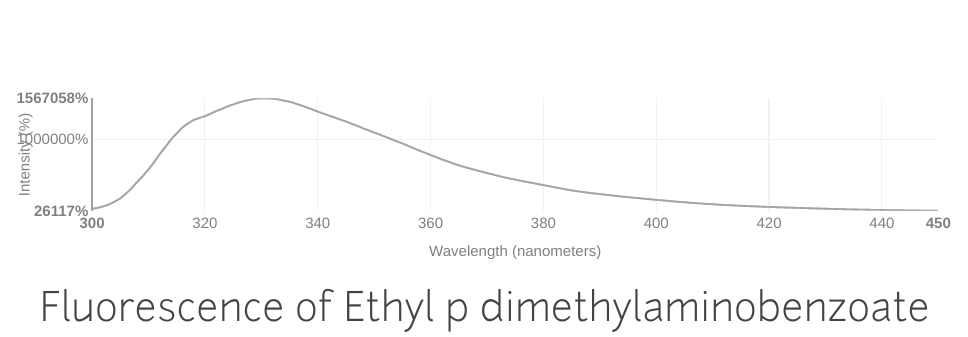
For a test, I just pasted the entire emission data file from http://omlc.org/spectra/PhotochemCAD/html/111.html into the CSV upload form:
Note that this is a scanning fluorescence spectrum (from a Spex FluoroMax), where the excitation wavelength was 4.25nm lower than the emission (scanned) wavelength.
David haffner sr
May 6, 2016, 6:29:23 PM5/6/16
to plots-spe...@googlegroups.com
Hey Jeff, man that is awesome! Yes, I should have pointed that out when I did the comparison of the Plab spectrometer vs the spexfluoromax.
Jeffrey Warren
May 10, 2016, 3:52:04 PM5/10/16
to plots-spe...@googlegroups.com
Oh - also, wanted to ask; what file format does Spekwin use? Not sure if Friedrich is on the list, but I think he is. It'll be great to ensure Spectral Workbench can read output from Spekwin.
Thanks!
David haffner sr
May 10, 2016, 4:00:39 PM5/10/16
to plots-spe...@googlegroups.com
Hey Jeff, well I'm using windows 7 (ultimate) so I suppose his platform is windows but heres some info that might be useful:
Supported data formats include:
- ASCII, CSV, JCAMP-DX, THERMO GRAMS spc
- Perkin Elmer, Jasco, Shimadzu, Avantes Avasoft
- Ocean Optics, Varian Cary 50, Agilent HP8453,
- Stellarnet, Ascanis, VWR, Princeton Instruments WinSpec/WinView, Beckman Coulter DU 600/700
- Scinco Neosys, Horiba Datamax,
- RRUFF Raman database, and others
- Export data as:
ASCII, THERMO Galactic SPC, JCAMP-DX, CSV, RRUFF, or binary data - Batch Export as *.dx, spc, csv
- Batch export into dx, spc, csv multi-files
- Export plots as graphics
file:
WMF, GIF, PNG, TIFF, BMP

Jeffrey Warren
May 10, 2016, 4:03:01 PM5/10/16
to plots-spe...@googlegroups.com
Oh, thanks - I meant though, what is the default output, and/or what is the formatting of a CSV that it outputs. As long as there's one common format in common and moving files in both directions is easy, then we're all good.
Thanks!
Friedrich Menges
May 10, 2016, 4:15:33 PM5/10/16
to plots-spe...@googlegroups.com
Yes, I am connected via GoogleGroups. Spekwin32 is able to open 35+ file formats from a number of spectrometer systems. Export of ASCII data is done as *.csv, which can have contain a single spectrum as tab-separated x,y-paired values column as well as multiple spectra in x y x y x y x y columns. Delimiter, DecimalSeparator and ThousandsSeparator are taken from the current Windows settings.
The first line contains the legend texts, the second line contains the axis types. Example of multi-file (NIST data of polyaromatics absorbance):,Anthracene,,Chrysene,,Quinine,
Wavelength [nm],log(Epsilon),Wavelength [nm],log(epsilon),Wavelength [nm],log(epsilon),
300.598,4.1591,202.183,3.7361,220.620,4.7501,
300.801,4.168,202.672,3.7531,221.750,4.7096,
301.004,4.1729,203.160,3.7702,222.881,4.6782,
301.207,4.1775,203.649,3.7873,224.011,4.655,
301.411,4.182,204.138,3.8045,225.141,4.628,
301.614,4.1859,204.626,3.8216,226.271,4.6014,
301.817,4.1896,205.115,3.8389,227.402,4.5903,
302.020,4.1934,205.604,3.8561,228.532,4.5884,
302.223,4.1971,206.092,3.8734,229.662,4.5881,
302.426,4.2008,206.581,3.8907,230.793,4.5917,
302.629,4.2046,207.069,3.908,231.923,4.602,
302.832,4.2083,207.558,3.9254,233.053,4.6284,
303.035,4.212,208.047,3.9427,234.183,4.6503,
303.238,4.2128,208.535,3.9601,235.314,4.6718,
303.441,4.2135,209.024,3.9775,236.444,4.7168,
303.645,4.2141,209.513,3.9949,237.574,4.7603,
303.848,4.2147,210.001,4.0122,238.704,4.7956,
304.051,4.2153,210.490,4.0296,239.835,4.8323,
304.254,4.2159,210.979,4.047,240.965,4.878,
304.457,4.2165,211.467,4.0644,242.095,4.8992,
304.660,4.217,211.956,4.0817,243.226,4.9241,
304.863,4.2175,212.444,4.0991,244.356,4.953,
305.066,4.2179,212.933,4.1164,245.486,4.9881,
305.269,4.2184,213.422,4.1337,246.616,4.9983,
Jeffrey Warren
May 11, 2016, 11:20:48 AM5/11/16
to plots-spe...@googlegroups.com
Excellent - I pasted that directly into our CSV uploader (excluding the headers) and it got the first two columns without trouble.
We have an active issue open for units management that will help with the y-axis display, but the data is there.
Thanks, Friedrich!
Jeff
Reply all
Reply to author
Forward
0 new messages