Infragram Tutorial?
30 views
Skip to first unread message

Nicholas Johnson
Jul 22, 2014, 9:40:13 AM7/22/14
to plots-i...@googlegroups.com
Help! I used the infragram camera last weekend but I now have no idea how to process the images! I uploaded them to http://infragram.org/ and played with the templates and settings but couldnt seem to get anything interesting. Am I missing something? Are there any good tutorials about how to process the images? I searched the site but couldnt really find anything...
Thanks for the help in advance!
nick

Jeffrey Warren
Jul 22, 2014, 1:34:34 PM7/22/14
to Nicholas Johnson, plots-i...@googlegroups.com
A quick intro video or 2-minute crash course would be an excellent addition to the Infragram.org site, and if anyone makes one I'd happily post it on the front page.
In the meantime, the ? (help) button does lead to http://publiclab.org/wiki/infragram-sandbox which has an old video tutorial which basically tells you to "use the presets" which is not much more helpful than the presets themselves.
Can you share some of your photos, either in email or as a research note? Or as links on Infragram.org?
Finally, with a grant from the Raspberry Pi foundation, we are working with a curriculum writer to develop classroom activities and guides for this tool. I'm not sure what the latest is on that, but hopefully it'll result in some nice documentation on the wiki.
Jeff
--
Post to this group at plots-i...@googlegroups.com
Public Lab mailing lists (http://publiclab.org/lists) are great for discussion, but to get attribution, open source your work, and make it easy for others to find and cite your contributions, please publish your work at http://publiclab.org
---
You received this message because you are subscribed to the Google Groups "plots-infrared" group.
To unsubscribe from this group and stop receiving emails from it, send an email to plots-infrare...@googlegroups.com.
Nicholas Johnson
Jul 22, 2014, 2:06:10 PM7/22/14
to Jeffrey Warren, plots-i...@googlegroups.com
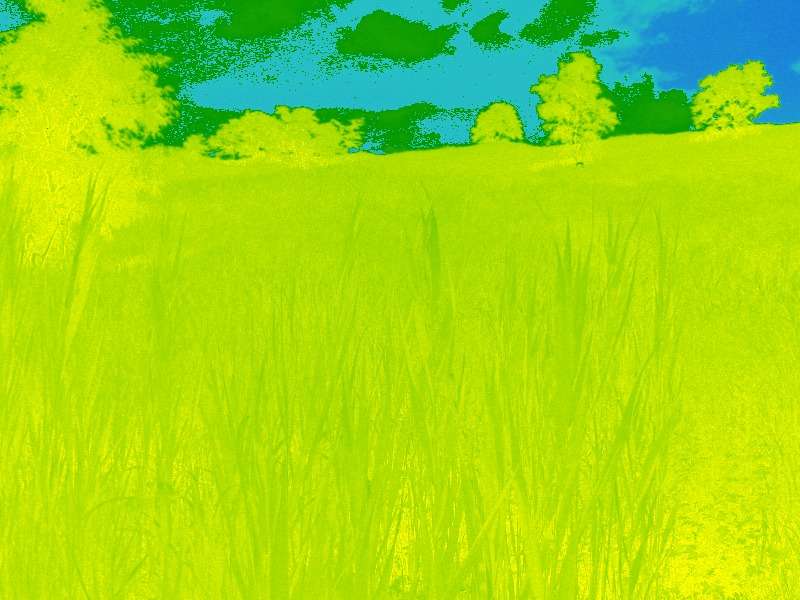
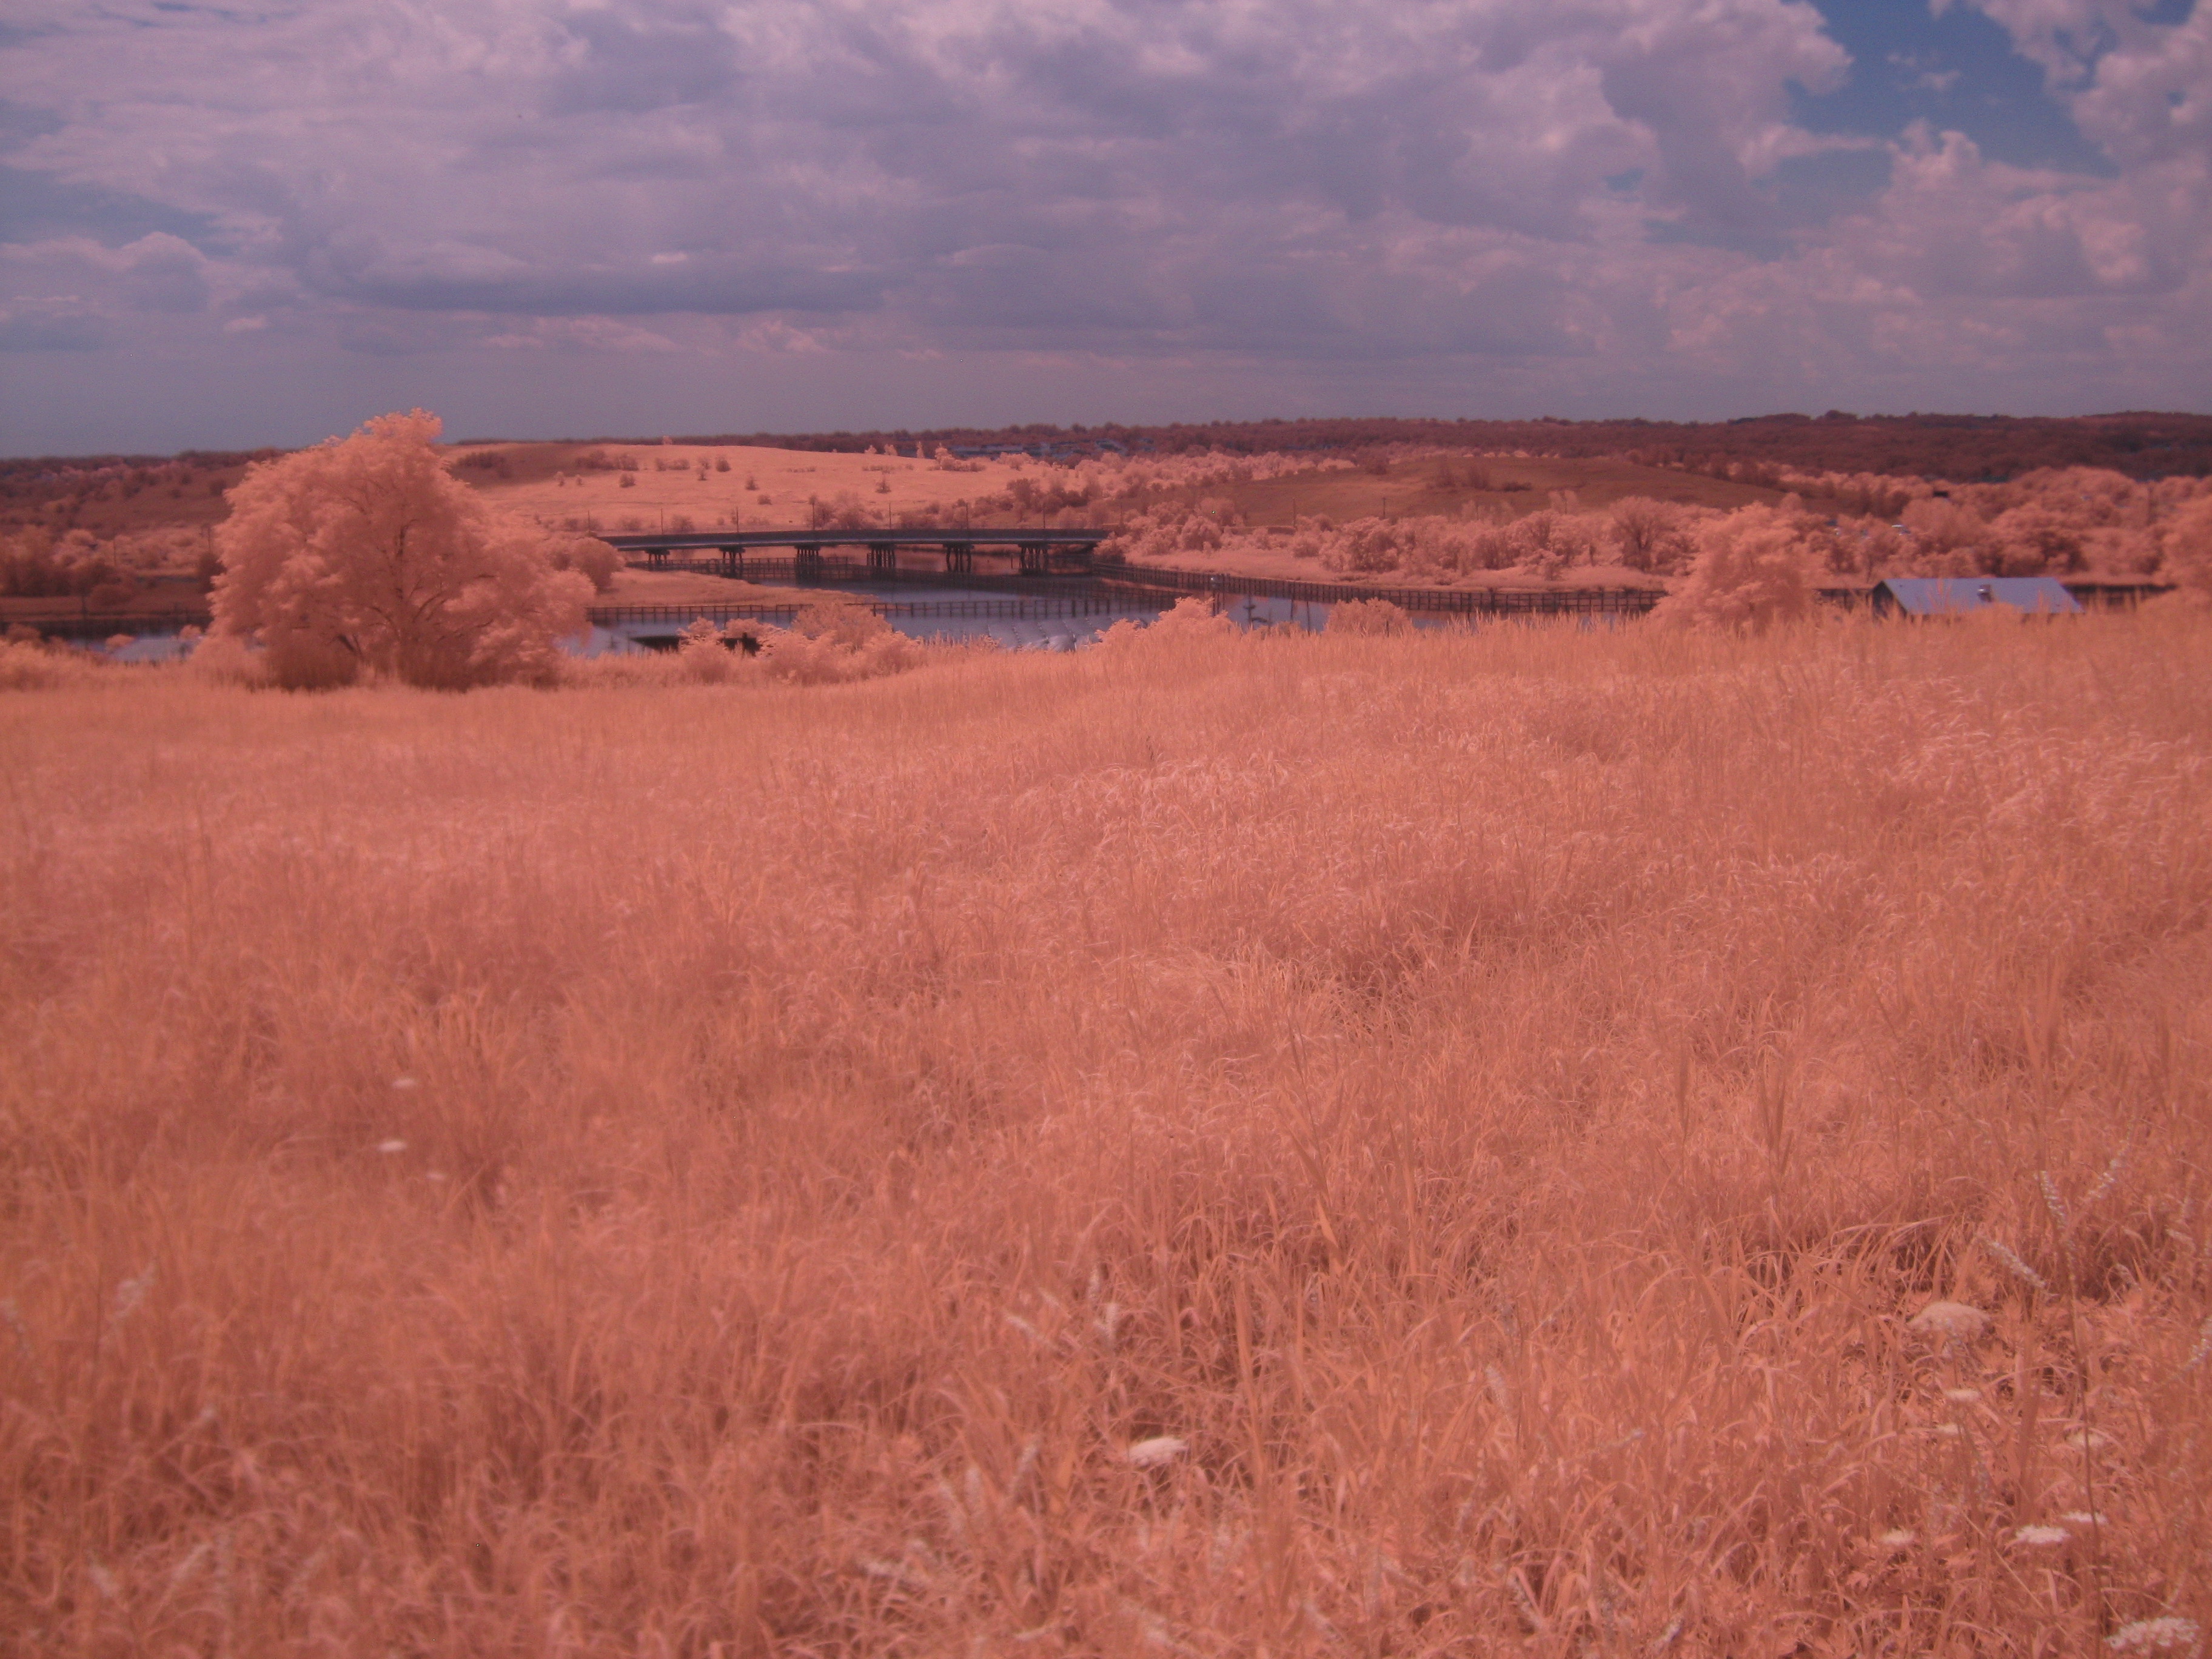
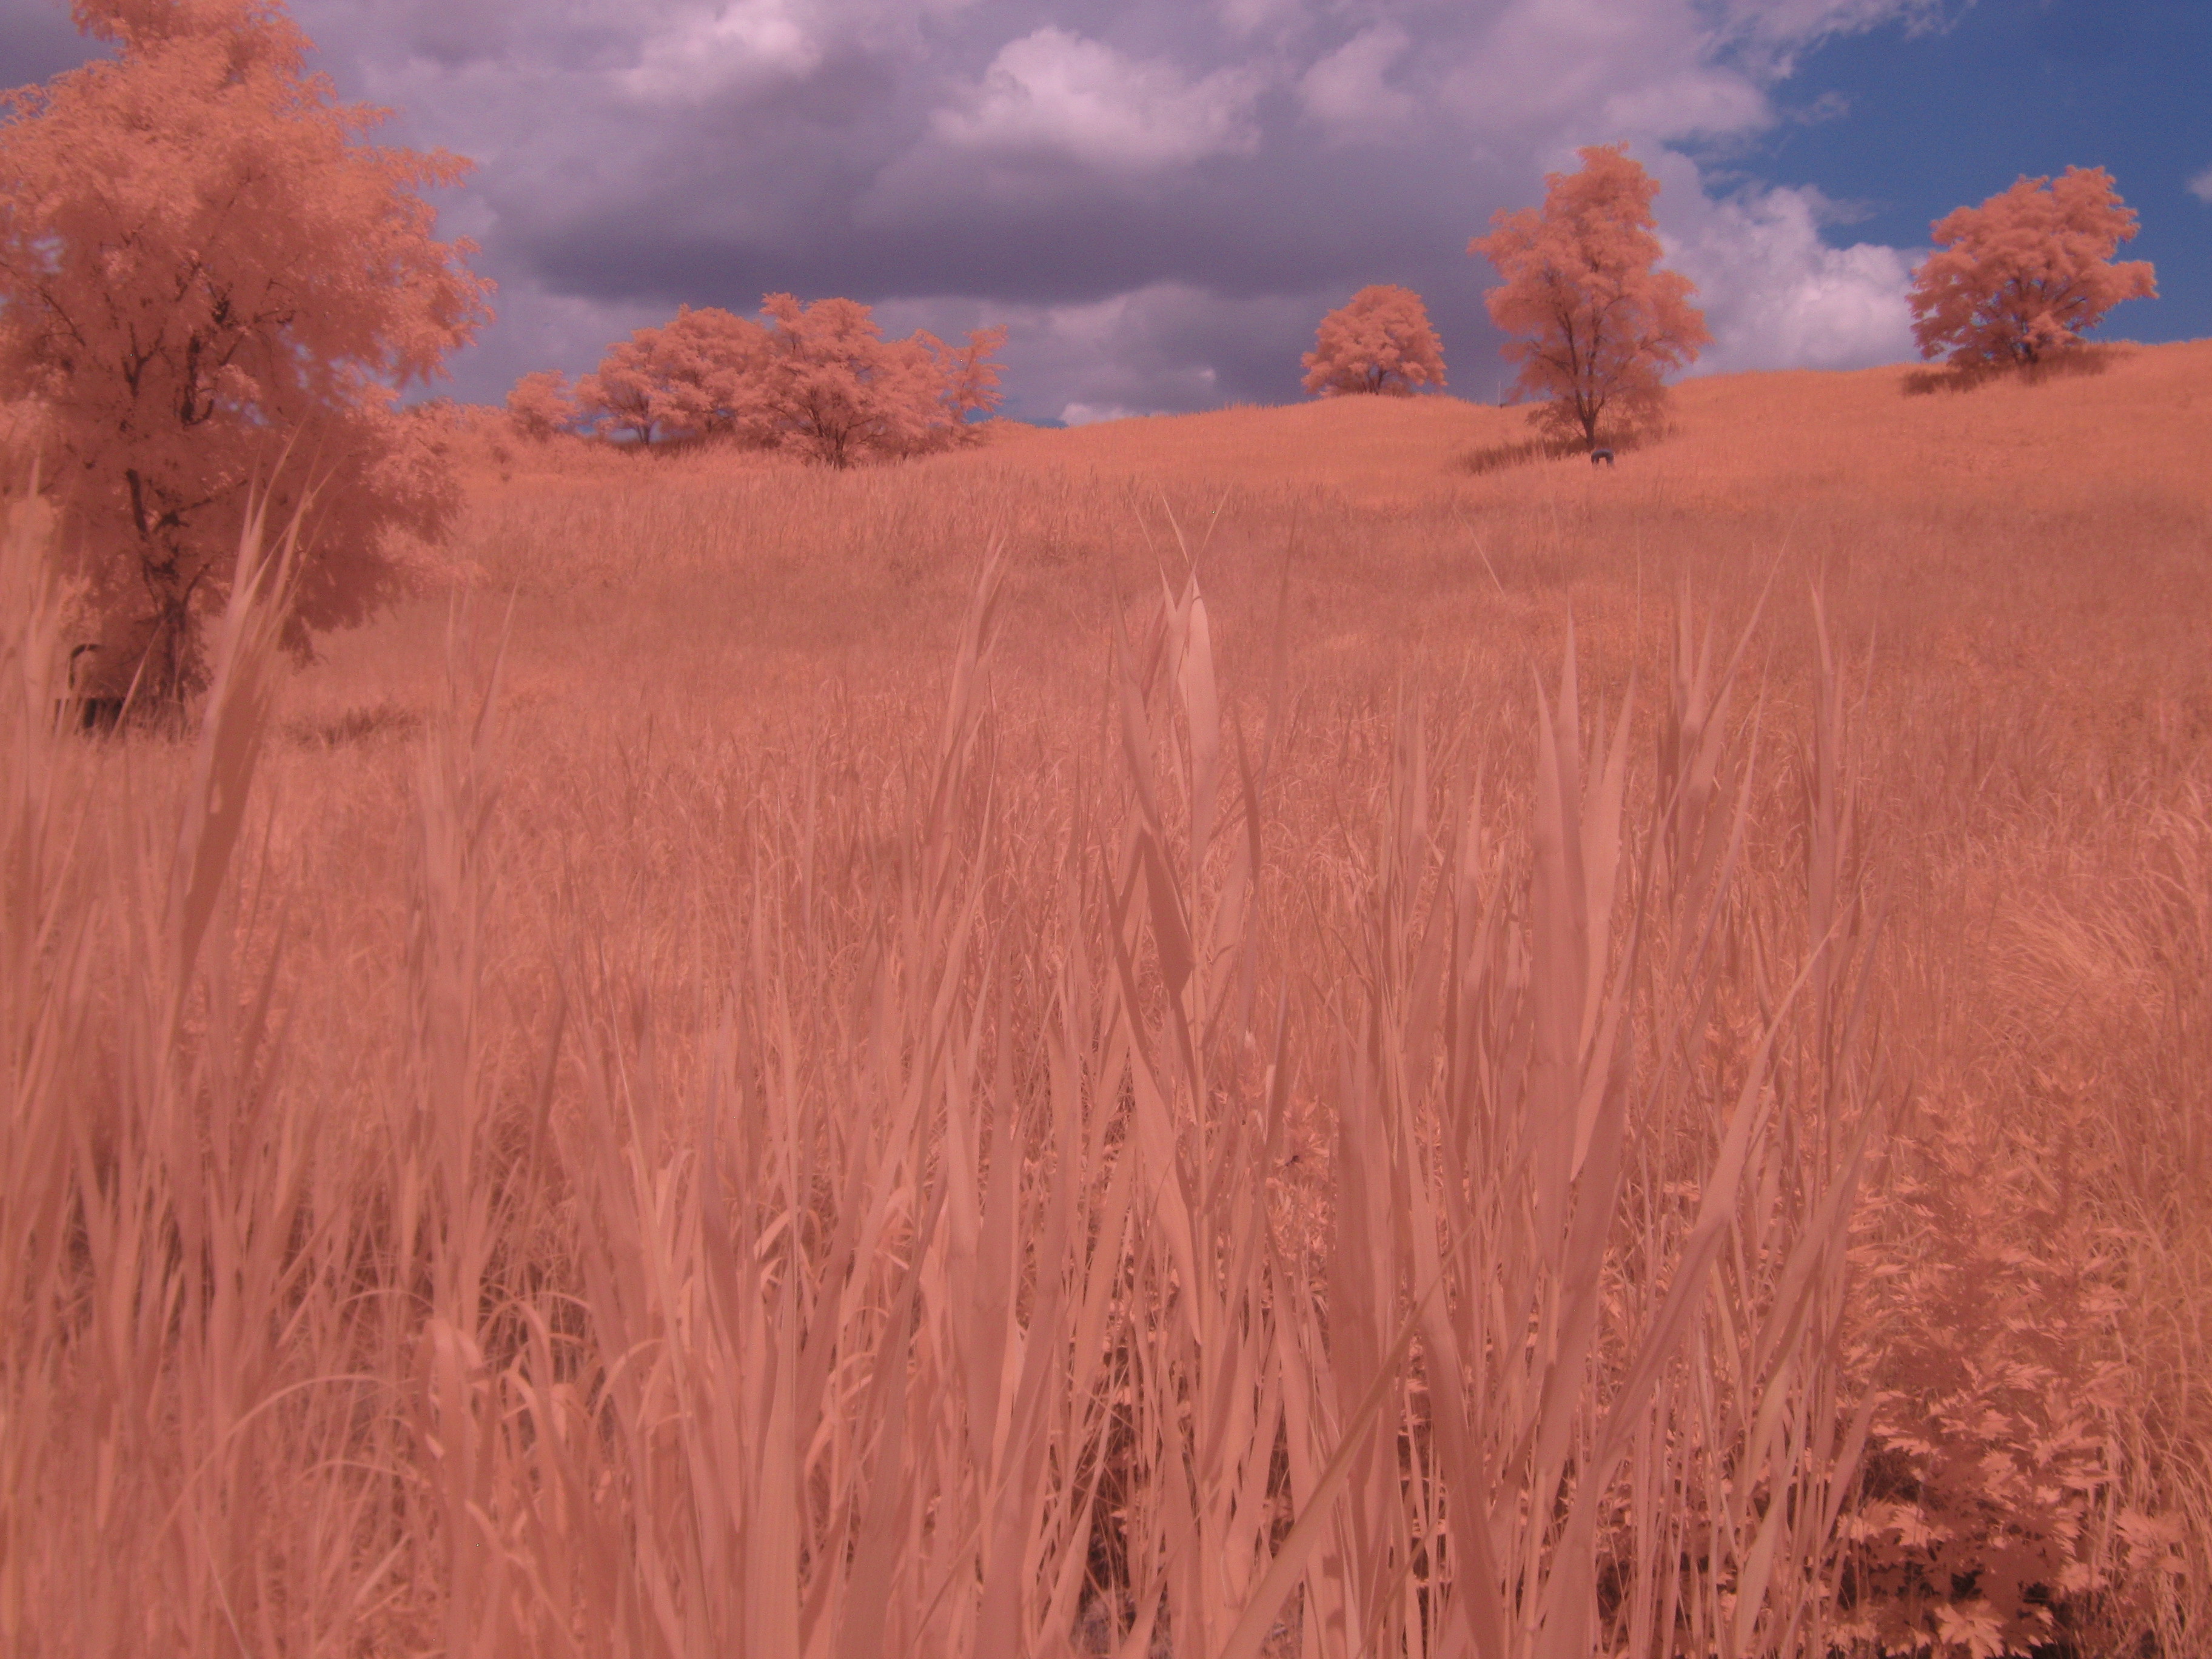
Thanks Jeff! Attached are a couple photos. I spent some time searching through the wiki pages and research notes but still feel like I dont know how to play with the setting instead of the just the presents. I find myself just changing the channel colors with little results. I'm going to keep playing with it..Thanks for the help!
nick
Jeffrey Warren
Jul 22, 2014, 2:09:40 PM7/22/14
to Nicholas Johnson, plots-i...@googlegroups.com
Hi, Nick - i just used the basic "blue filter" preset and the "stretched" colormap here: http://infragram.org/i/53cea8940ab503231b000ba0 which looks like it's mostly working, but perhaps not detecting a lot of variation. What's the research question you're trying to answer?
Jeff
Nicholas Johnson
Jul 22, 2014, 2:20:05 PM7/22/14
to Jeffrey Warren, plots-i...@googlegroups.com
Maybe that's just it....I guess I expected to see some variation...some of the photos are varied (ie have humans, buliding etc) but pretty much look the same after processing them. Perhaps it was just a really bright sunny day?
And then...what do the variations in color mean? My understanding is that the more intense red (blue > red) colors mean more IR which means more photosynthesis which means more health? Something like that?
Jeffrey Warren
Jul 23, 2014, 11:05:33 AM7/23/14
to Nicholas Johnson, plots-i...@googlegroups.com
I very much agree that we need a more in-depth guide to how to interpret imagery. I'm hoping this will be part of the curriculum development efforts, but as we've seen in some of the posts to this list, there are many issues at play. Maybe having a page at http://publiclab.org/wiki/infragram-image-interpretation would be good... and I'm sure there's been lots of bits and pieces and examples of interpretation across the site, but to collate and list them, and to derive a more general set of principles, would be great.
I think the most important part will be helping people formulate experiments -- what are you hoping to detect? What is your point of comparison (health vs. what baseline)? Basic experimental design, use of positive and negative controls where it's possible, etc. In your case, do you have a hypothesis about which areas of grass might be healthier and why?
Jeff

Chris Fastie
Jul 24, 2014, 11:16:39 AM7/24/14
to plots-i...@googlegroups.com, nejoh...@gmail.com, je...@publiclab.org
Nick,
Your infrablue photos look like should produce meaningful NDVI images. This time of year, foliage from most healthy deciduous plants (grass, herbs, trees) is going to have similar NDVI values. So you wouldn't expect NDVI to distinguish different species or types of plants. There will be some differences, for example between Phragmites and maple, but those will be subtle. Other, non-biological, sources of variation in NDVI values (sun angle, shadows, exposure) can result in greater differences than plant species, and even greater differences than between healthy and stressed plants. So DIY NDVI images have to be interpreted with caution, and the fine details in the images usually should not be interpreted at all.
Chris
Reply all
Reply to author
Forward
0 new messages