AI2, JavaScript API Chart.js. Statistical graphs, bars, lines, pie. Easy.
5,063 views
Skip to first unread message

Juan Antonio
Feb 18, 2017, 9:01:44 AM2/18/17
to mitappinv...@googlegroups.com
Hi Friends,
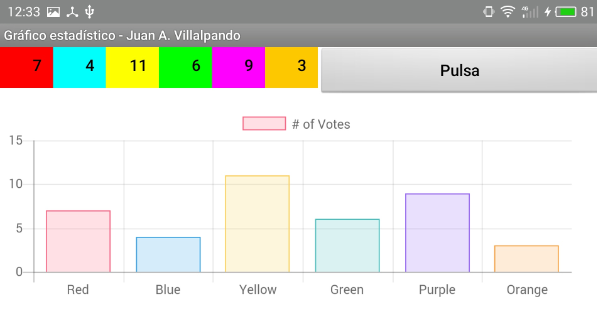
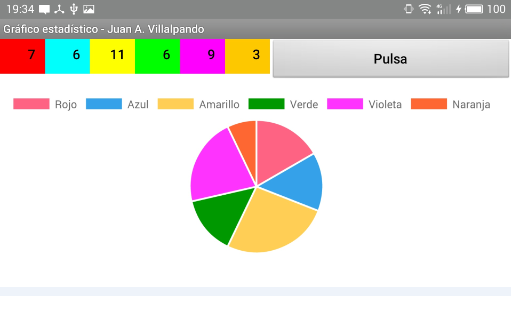
by JavaScript API Chart.js you can build statistical graphs, lines, pie, bars,...
API Chart.js: http://www.chartjs.org/docs/
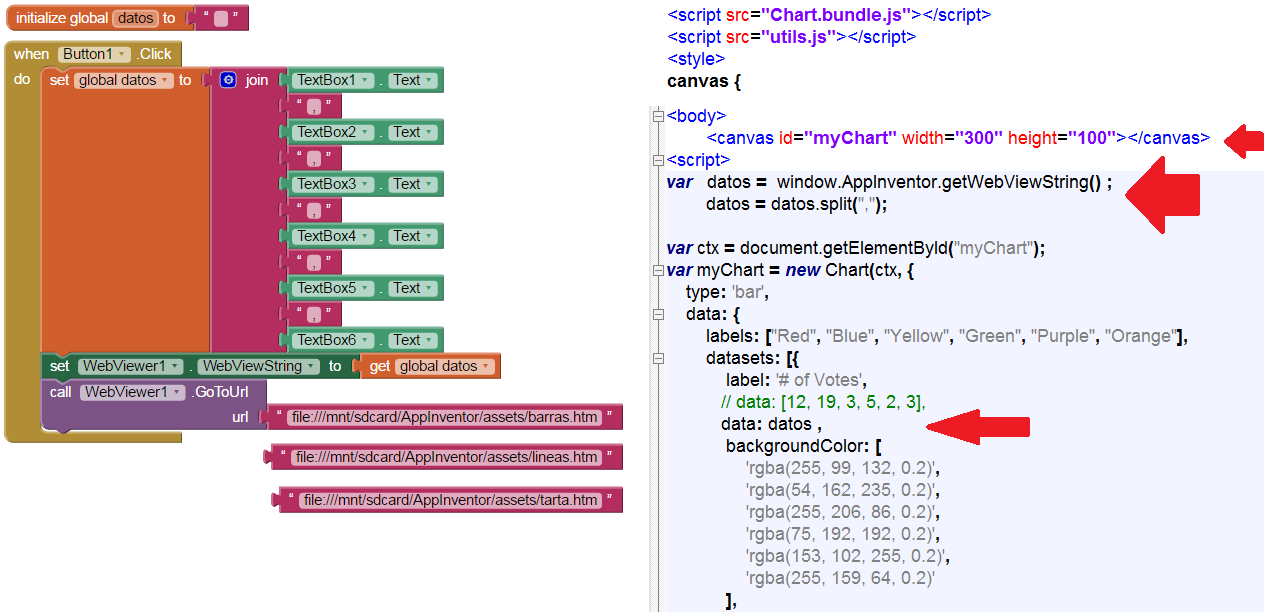
You need upload to your app Chart.bundle.js and utils.js files, then JS get datas by
var datos = window.AppInventor.getWebViewString();
datos = datos.split(",");
// data: [12, 19, 3, 5, 2, 3],
data: datos,
You can write numbers in TextBox and then click in "Pulsa" Button.
Regards.

Taifun
Feb 18, 2017, 10:26:07 AM2/18/17
to MIT App Inventor Forum
great examples!
earlier I also played around with the chart.js library, see also https://puravidaapps.com/pie.php
your example shows very nice, what else is possible using that library!
Taifun
Juan Antonio
Feb 18, 2017, 2:21:41 PM2/18/17
to MIT App Inventor Forum
Thank you Taifun, great work with Extensions in your site.
Reply all
Reply to author
Forward
0 new messages