HOWTO: Torus Chart on Canvas
391 views
Skip to first unread message

TimAI2
Aug 6, 2019, 4:20:42 PM8/6/19
to mitappinv...@googlegroups.com
What is a torus chart, well it is a doughnut (donut) chart.
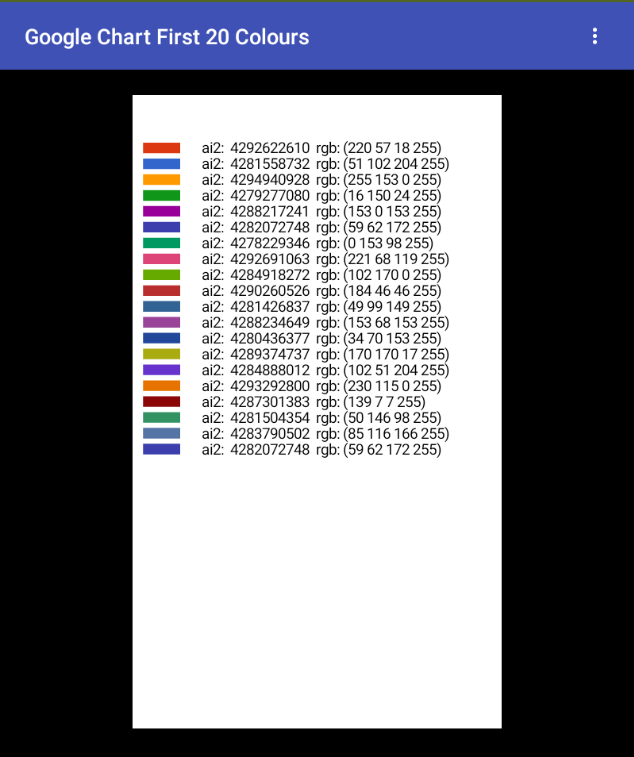
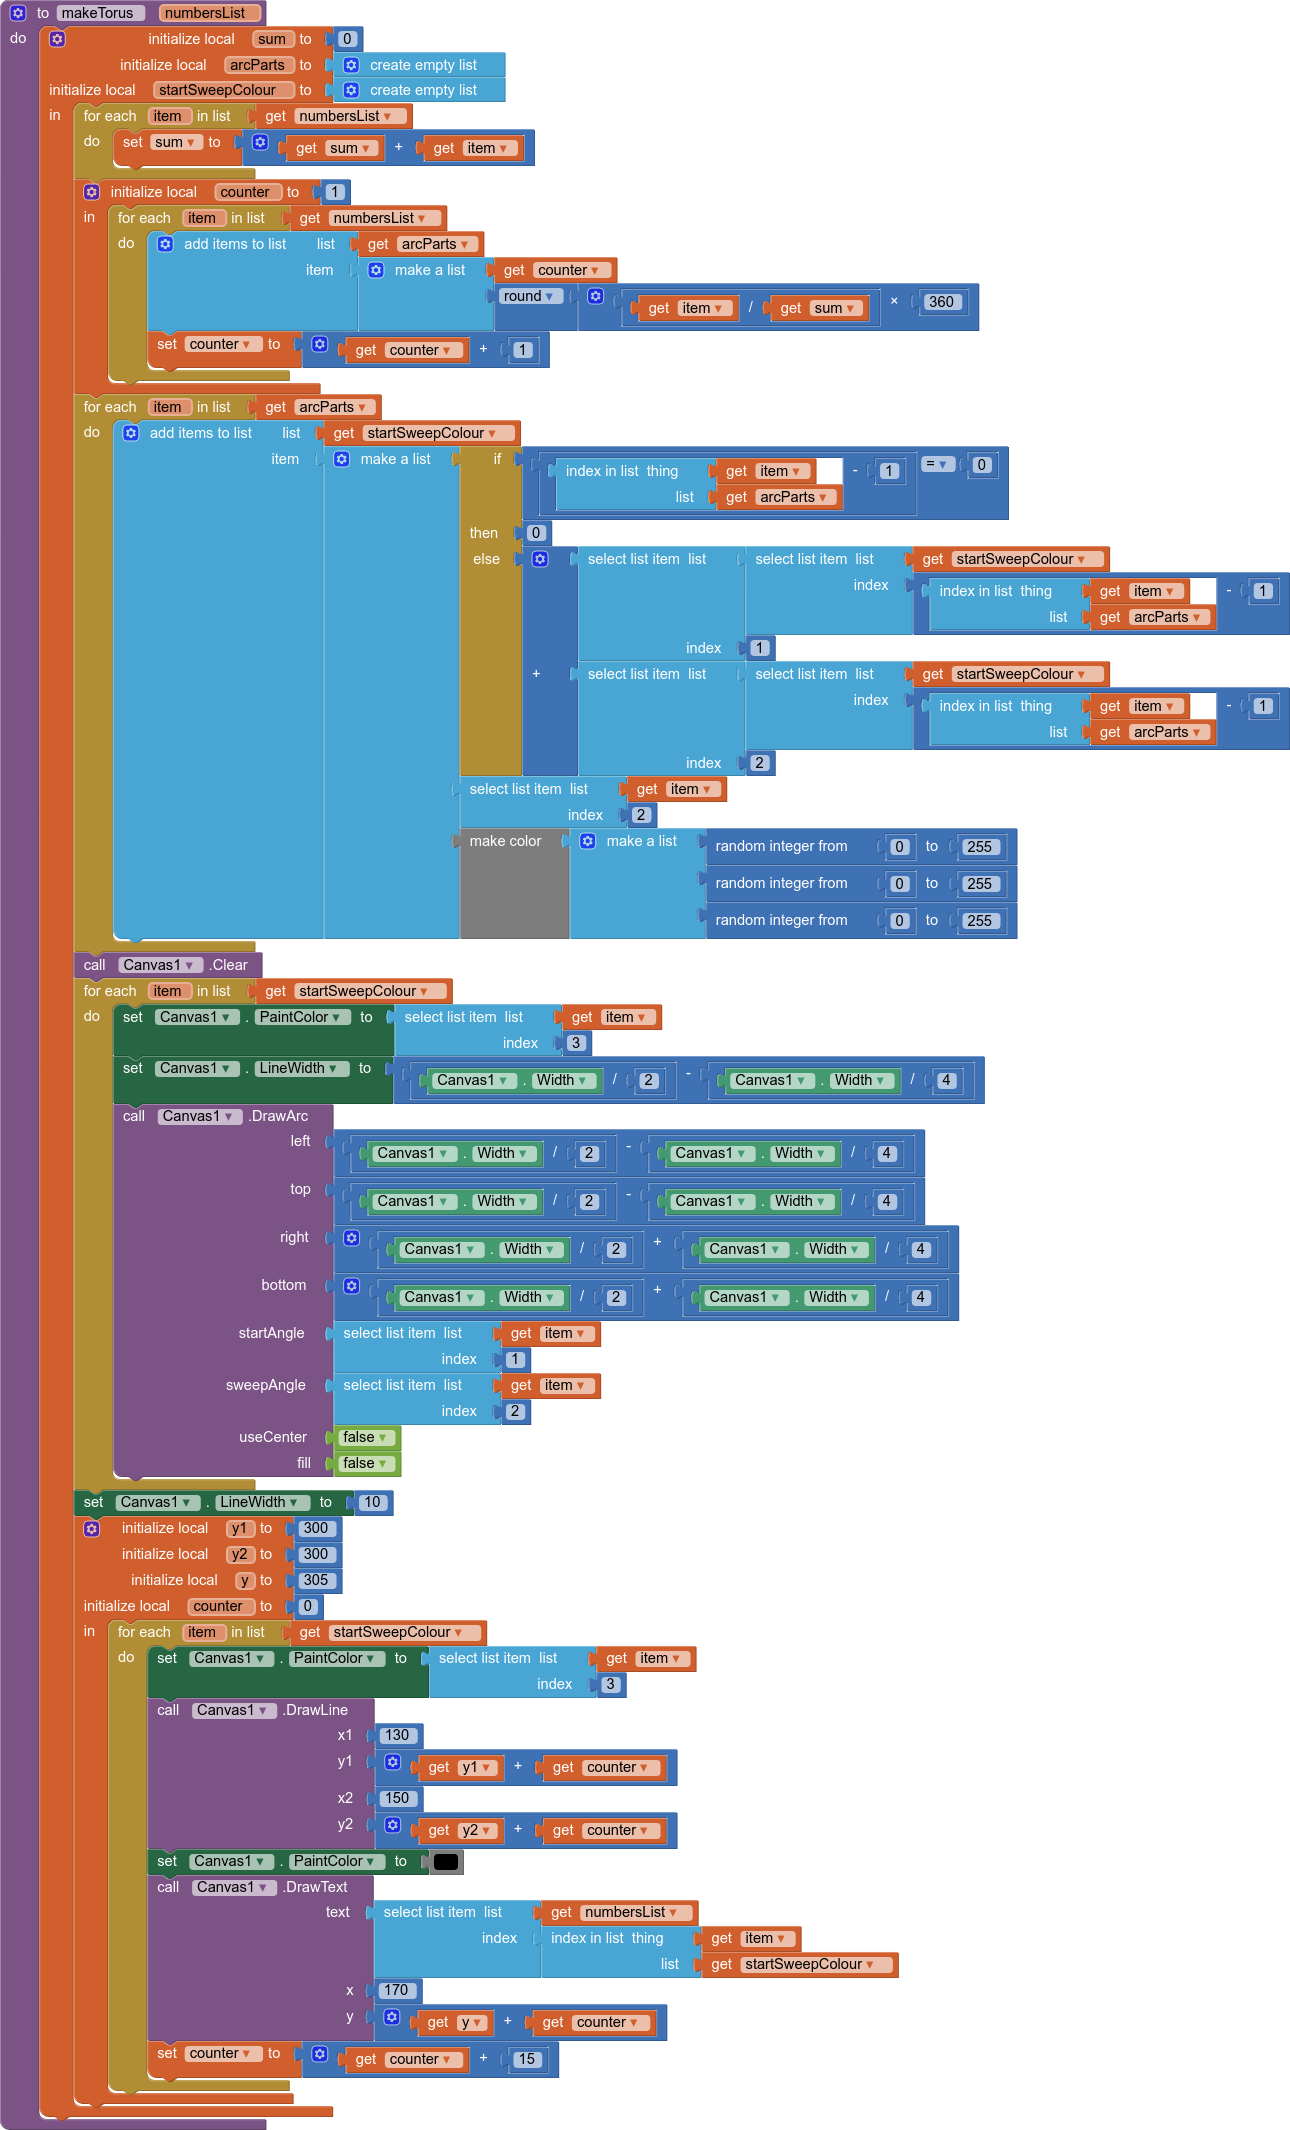
This first example uses a list of values, which are fed into a procedure
which generates the torus chart and creates a legend. no mess, no fuss, just that.
TimAI2
Aug 6, 2019, 4:22:52 PM8/6/19
to mitappinv...@googlegroups.com
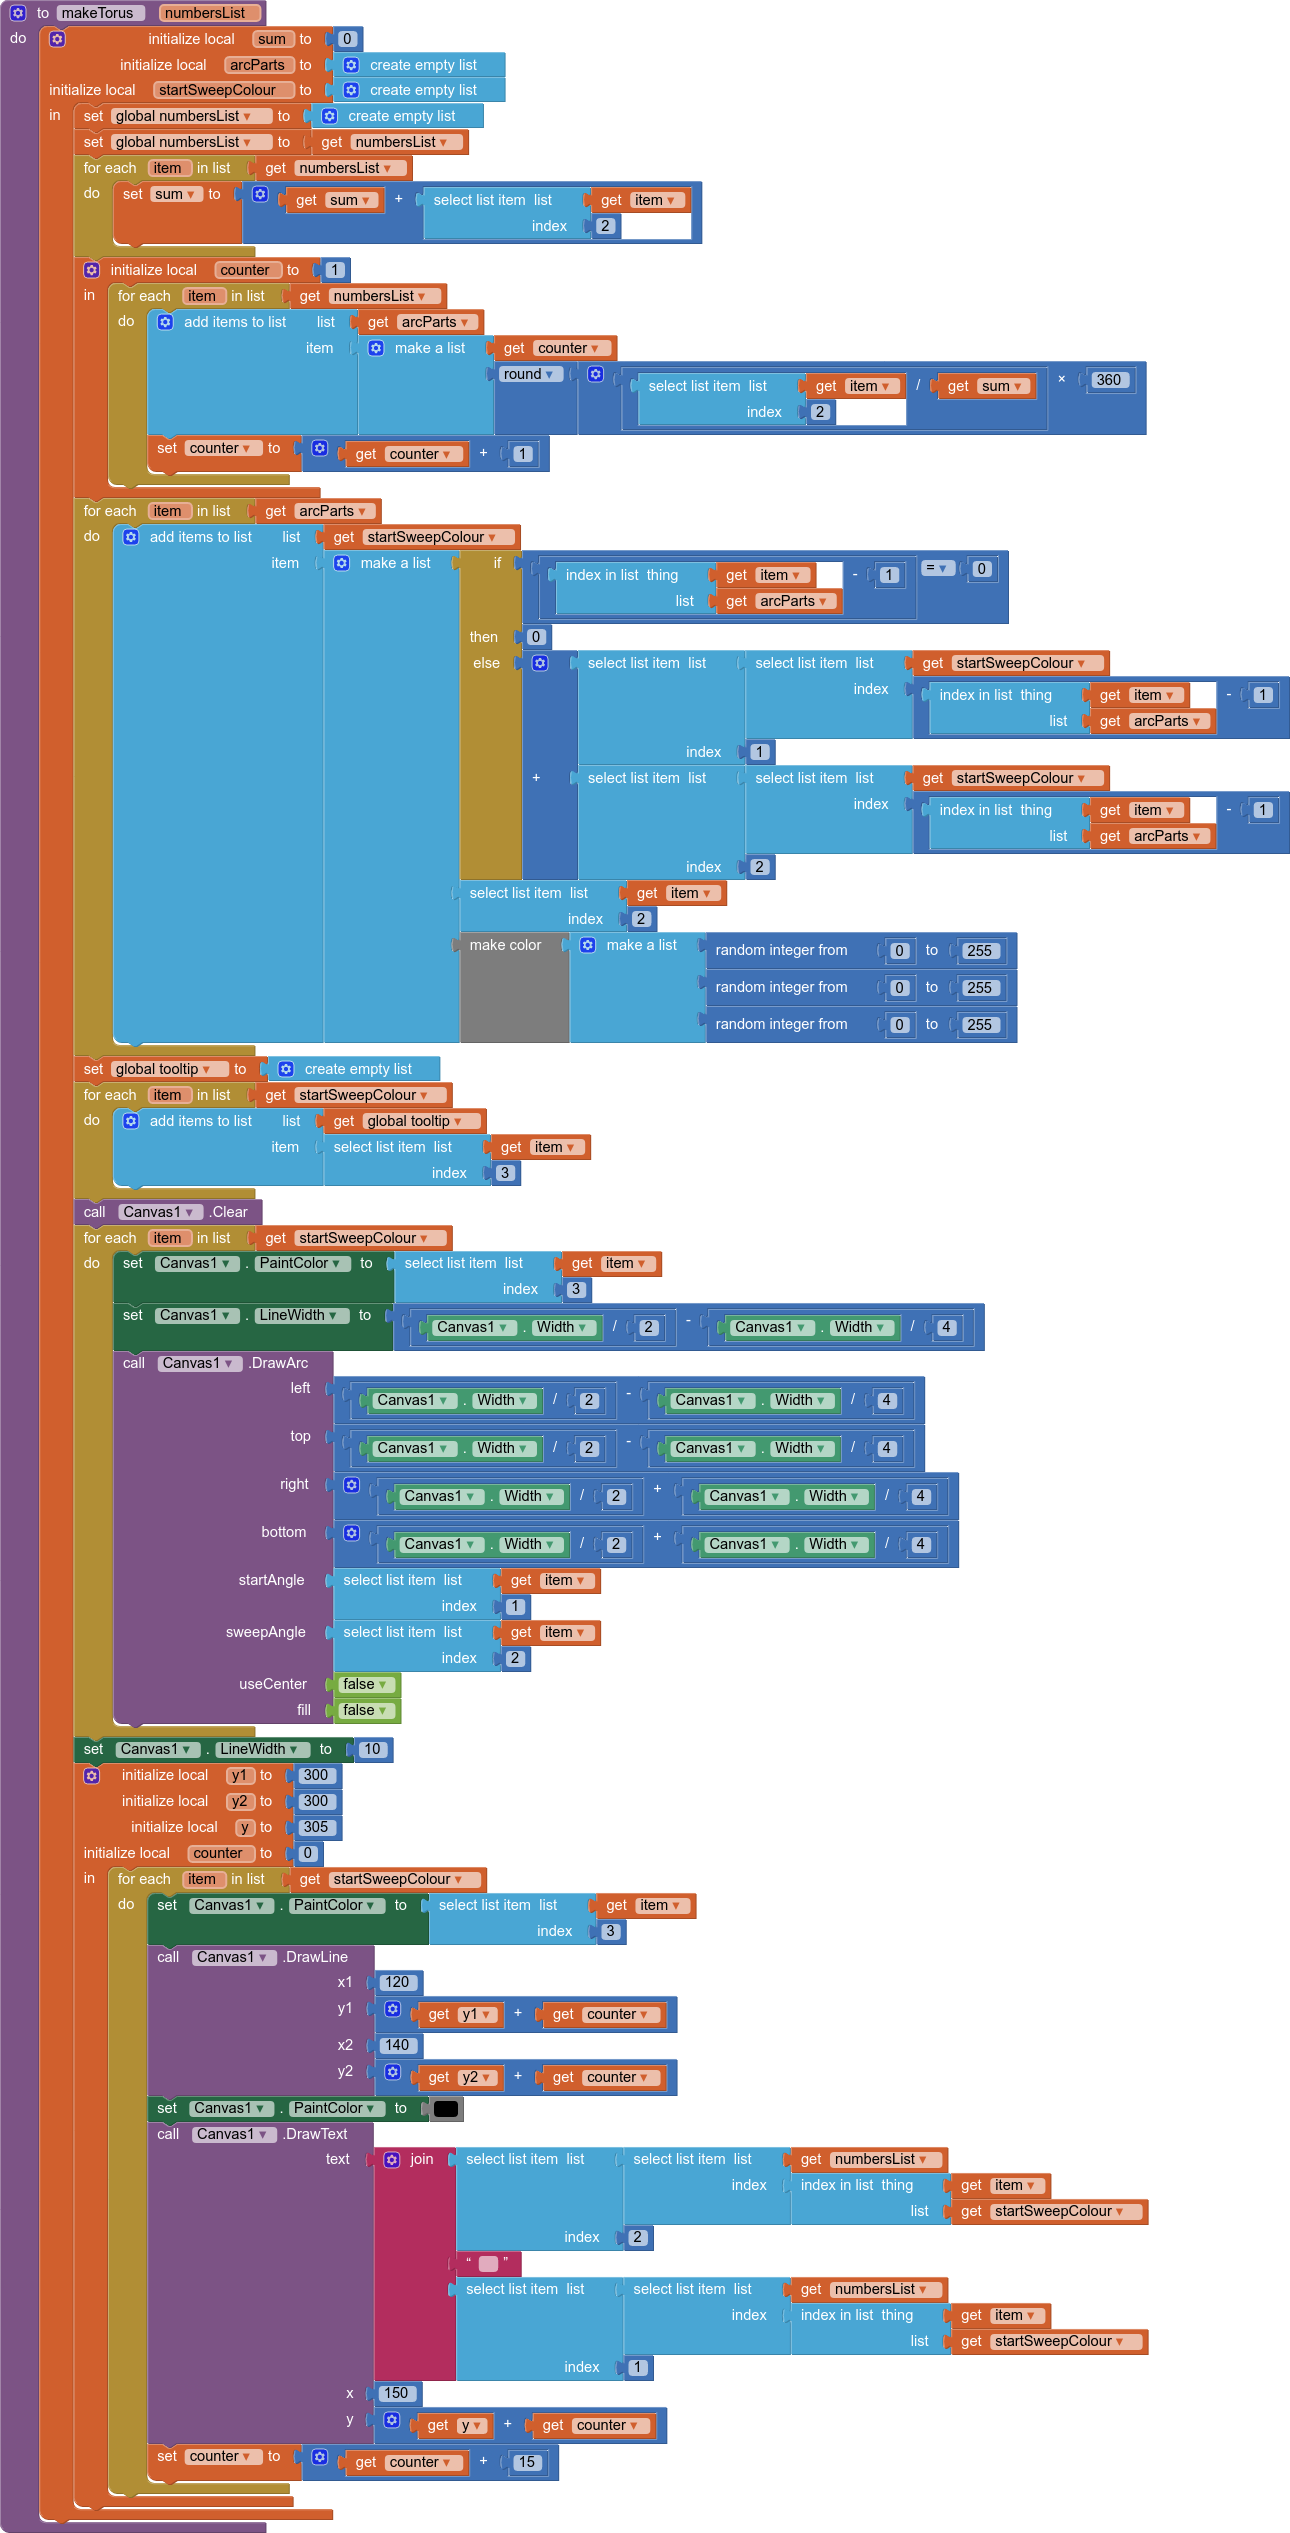
This second example uses a list of lists with labels and values
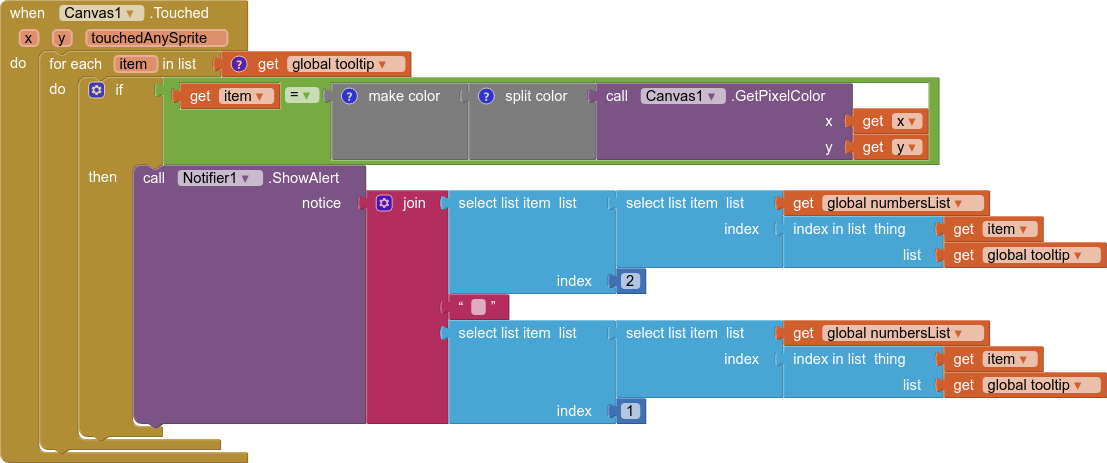
It also provides a tooltip type experience when a segment of the torus is touched/clicked
A couple of global variables and the canvas touched event required for this

ABG
Aug 6, 2019, 5:33:21 PM8/6/19
to MIT App Inventor Forum

SteveJG
Aug 6, 2019, 7:57:04 PM8/6/19
to MIT App Inventor Forum
And other implementations 2014 https://groups.google.com/forum/#!msg/mitappinventortest/VtOxig2EDlo/iIHxqjWm0WMJ;context-place=forum/mitappinventortest
which shows how flexible graphing can be using the Canvas object with App Inventor.
Regards,
Steve
ABG
Aug 6, 2019, 10:51:50 PM8/6/19
to MIT App Inventor Forum
Nice threads!
ABG
0 new messages