How do I ensure the baselines for a dual-axis chart match up with one another?
234 views
Skip to first unread message

bsp...@gmail.com
Oct 8, 2014, 1:38:59 PM10/8/14
to google-visua...@googlegroups.com
I have a Google Combination Chart where I am using two y axes.
At present, the baselines for each axis are at a different level.
I wish to ensure that the baselines for each axis are at the same level.
The code I am currently using to display my graph is shown below:
<html>
    <head>
        <script type="text/javascript" src="https://www.google.com/jsapi"></script>
        <script>

 google.load("visualization", "1", {packages:["corechart"]});
 google.setOnLoadCallback(drawChart);
 function drawChart() {


 var data = new google.visualization.DataTable();


 data.addColumn('number', 'Sales');
 data.addColumn('number', 'Total PnL');
 data.addColumn('number', 'Total Margin');


 data.addRows([  [6.5,150.6,0.6604],
                            [7.0,-275,-1],
                            [7.5,-128.45000,-0.30368],
                            [8.0,345.5,0.63904761],
                            [8.5,-316.56000,-0.07868],
                            [9.0,-118.26000,-0.09587],
                            [9.5,-899.0699,-0.236790],
                            [10.0,-242.6800,-0.40805],
                            [10.5,28.1700,0.00786]  ]);


 var options = {
 title: 'Graph 1',
 tooltip: {textStyle: {fontSize:14}},
 titleTextStyle:{fontSize:12},
 hAxis: {title: 'time', titleTextStyle: {color: 'red',fontSize:15}, textStyle: {fontSize:11,fontStyle:'bold'}},
 legend: {maxLines:5,textStyle: {fontSize: 11.5}},
 seriesType: "bars",
 series: {
 0: {type: "bar",targetAxisIndex:0,color:'#000000'},
 1: {type: "line",targetAxisIndex:1,color:'#333333'},
 },
 vAxes:{
 0:{title:'PnL',titleTextStyle: {fontSize:14},textStyle:{color: 'blue',fontSize:15},format:'£###,###,###'},
 1:{title:'Margin',titleTextStyle: {fontSize:14},textStyle:{color: 'red',fontSize:15},format:'#.###%'}
 }
 };


  var chart = new google.visualization.ComboChart(document.getElementById('graphdiv'));
  chart.draw(data, options);
 }


 </script>
    </head>
    <body>
        <div id='graphdiv' style='width: 900px; height: 500px;'></div>
    </body>
    </html>
This produces the following graph:
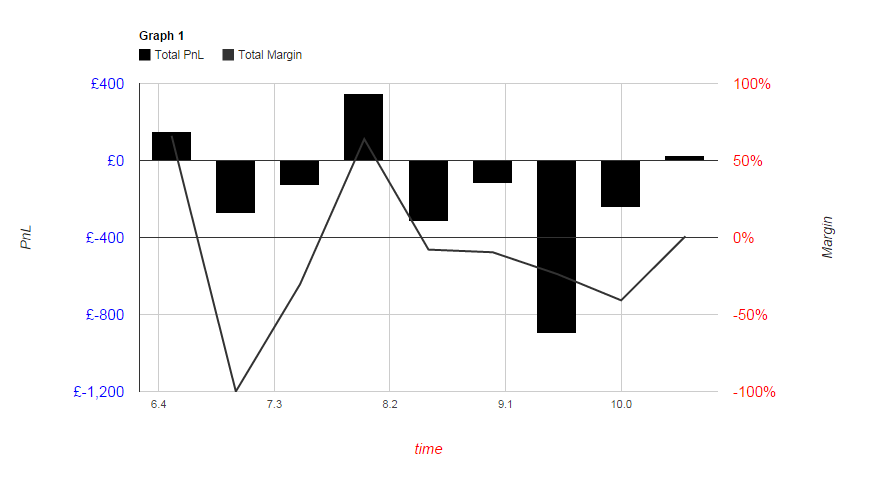
I am aware that making use of the minValue and maxValue properties of each of the vAxes could be one way of dealing with this situation. But I am not sure how exactly I might do so.
Also, are there any future plans to make this a simple matter of adding
baseline-equal:trueto the vAxes options?
I apologise if this is the incorrect forum in which to ask about this issue.

Andrew Gallant
Oct 8, 2014, 8:55:40 PM10/8/14
to google-visua...@googlegroups.com
If having the baseline always be in the center of the chart is acceptable (even when there are no data points below it), there is an easy solution to this problem: get the min/max for each series and set the minValue/maxValue options to the negative of the opposite value: this will ensure that the actual min/max that the chart uses to determine the axis range is symmetrical around 0, and thus both axes should share a baseline at the center of the chart.
var axis0Range = data.getColumnRange(1);
var axis1Range = data.getColumnRange(2);
var axis0Range = data.getColumnRange(1);
in the vAxes option:
vAxes:{
0:{
title:'PnL',
titleTextStyle: {fontSize:14},
textStyle:{color: 'blue',fontSize:15},
format:'£###,###,###',
// swap the min/max and multiply by -1
minValue: axis0Range.max * -1,
maxValue: axis0Range.min * -1
},
1:{
title:'Margin',
titleTextStyle: {fontSize:14},
textStyle:{color: 'red',fontSize:15},
format:'#.###%',
// swap the min/max and multiply by -1 minValue: axis1Range.max * -1,
maxValue: axis1Range.min * -1
}
}
bsp...@gmail.com
Oct 9, 2014, 2:13:19 PM10/9/14
to google-visua...@googlegroups.com
Many thanks for your quick response to my question. Your solution does indeed do what I require.
Reply all
Reply to author
Forward
0 new messages