Stacked bar chart re:Data Value Markers Options

Todlerone
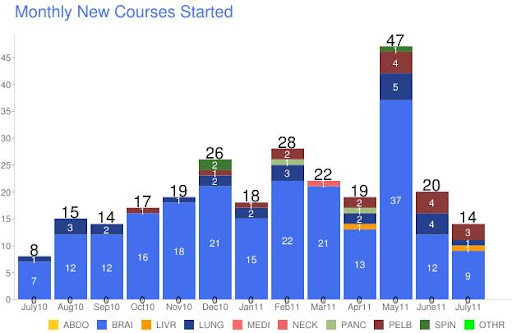
successfully added a stacked bar chart with Data Value Markers,
however, for the life of me I can't seem to get rid of an extra row of
"0''s that have appeared.
Here is my code.....and again TY.
<div id="chart"></div>
<script type="text/javascript">
var queryString = '';
var dataUrl = '';
function onLoadCallback() {
if (dataUrl.length > 0) {
var query = new google.visualization.Query(dataUrl);
query.setQuery(queryString);
query.send(handleQueryResponse);
} else {
var dataTable = new google.visualization.DataTable();
dataTable.addRows(140);
<?php $numCOL = count($regions);
for($i=0; $i<$numCOL; $i++){
echo "dataTable.addColumn('number');\n";
}
$a=0;
$x=0;
foreach($courseMONTH as $key => $row):
if ($a<=12){
foreach ($row as $value):
echo"dataTable.setValue(".$a.", ".$x.", ".$value.");\n";
$x++;
endforeach;
}
$a++;$x=0;
endforeach;
?>
draw(dataTable);
}
}
function draw(dataTable) {
var vis = new google.visualization.ImageChart(document.getElementById('chart'));
var options = {
chxl: '0:|July10|Aug10|Sep10|Oct10|Nov10|Dec10|Jan11|Feb11|Mar11|Apr11|May11|June11|July11|',
chds: 'a',
chxp: '',
chma: '30,30,30,30',
chm: 'N,000000,-1,,20|N,000000,0,,12,,c|N,ffffff,1,,12,,c|N,ffffff,2,,12,,c|N,ffffff,3,,12,,c|N,ffffff,4,,12,,c|N,ffffff,5,,12,,c|N,ffffff,6,,12,,c|N,ffffff,7,,12,,c|N,ffffff,8,,12,,c|N,ffffff,9,,12,,c',
chxr: '',
chxs: '',
chxtc: '',
chxt: 'x,y',
chbh: '40',
chs: '700x400',
cht: 'bvs',
chco: 'FDD017,436eee,FF9900,27408b,ff6a6a,ee6363,A2C180,8b3a3a,3D7930,00ff00',
chdlp: 'b',
chdl: 'ABDO|BRAI|LIVR|LUNG|MEDI|NECK|PANC|PELB|SPIN|OTHR',
chtt: 'Monthly New Courses Started',
chts:'436eee,20,l'
};
vis.draw(dataTable, options);
}
function handleQueryResponse(response) {
if (response.isError()) {
alert('Error in query: ' + response.getMessage() + ' ' + response.getDetailedMessage());
return;
}
draw(response.getDataTable());
}
google.load("visualization", "1", {packages:["imagechart"]});
google.setOnLoadCallback(onLoadCallback);
</script>
Todlerone
On Jul 28, 2:59 pm, Todlerone <poke...@quickclic.net> wrote:
> Hello all and TY in advance for any help/suggestions. I have
> successfully added a stacked bar chart with Data Value Markers,
> however, for the life of me I can't seem to get rid of an extra row of
> "0''s that have appeared.
>
Todlerone
> > chxr: '',
>
> > chxs: '',
>
> > chxtc: '',
>
> > chxt: 'x,y',
>
> > chbh: '40',
>
> > chs: '700x400',
>
> > cht: 'bvs',
>
> > chco:
> > 'FDD017,436eee,FF9900,27408b,ff6a6a,ee6363,A2C180,8b3a3a,3D7930,00ff00',
>
> > chdlp: 'b',
>
> > chdl: 'ABDO|BRAI|LIVR|LUNG|MEDI|NECK|PANC|PELB|SPIN|OTHR',
>
> > chtt: 'Monthly New Courses Started',
>
> > chts:'436eee,20,l'
>
> > };
>
> > vis.draw(dataTable, options);
>
> > }
>
> > function handleQueryResponse(response) {
>
> > if (response.isError()) {
>
> > alert('Error in query: ' + response.getMessage() + ' ' +
> > response.getDetailedMessage());
>
> > return;
>
> > }
>
> > draw(response.getDataTable());
>
> > }
>
> > google.load("visualization", "1", {packages:["imagechart"]});
>
> > google.setOnLoadCallback(onLoadCallback);
>
>
> - Show quoted text -

asgallant
Todlerone
> > > chxr: '',
>
> > > chxs: '',
>
> > > chxtc: '',
>
> > > chxt: 'x,y',
>
> > > chbh: '40',
>
> > > chs: '700x400',
>
> > > cht: 'bvs',
>
> > > chco:
> > > 'FDD017,436eee,FF9900,27408b,ff6a6a,ee6363,A2C180,8b3a3a,3D7930,00ff00',
>
> > > chdlp: 'b',
>
> > > chdl: 'ABDO|BRAI|LIVR|LUNG|MEDI|NECK|PANC|PELB|SPIN|OTHR',
>
> > > chtt: 'Monthly New Courses Started',
>
> > > chts:'436eee,20,l'
>
> > > };
>
> > > vis.draw(dataTable, options);
>
> > > }
>
> > > function handleQueryResponse(response) {
>
> > > if (response.isError()) {
>
> > > alert('Error in query: ' + response.getMessage() + ' ' +
> > > response.getDetailedMessage());
>
> > > return;
>
> > > }
>
> > > draw(response.getDataTable());
>
> > > }
>
> > > google.load("visualization", "1", {packages:["imagechart"]});
>
> > > google.setOnLoadCallback(onLoadCallback);
>
> > > </script>- Hide quoted text -
>

Jinji
--
You received this message because you are subscribed to the Google Groups "Google Visualization API" group.
To post to this group, send email to google-visua...@googlegroups.com.
To unsubscribe from this group, send email to google-visualizati...@googlegroups.com.
For more options, visit this group at http://groups.google.com/group/google-visualization-api?hl=en.
