CPU Profiler does not display calls
235 views
Skip to first unread message

scott....@sap.com
Oct 2, 2012, 4:02:25 PM10/2/12
to google-chrome-...@googlegroups.com
Hi,
I'm trying to get the CPU Profiler tool in Chrome to work and I'm seeing some odd behaviour. This was working for me earlier today. I was able to get a cpu captured and navigate around the various call stacks no problem. Then it stopped working when I did something more DOM-intensive and now even my simple case doesn't work any more.
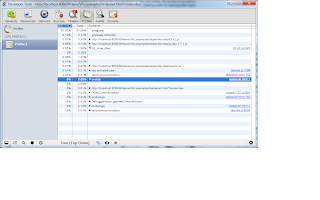
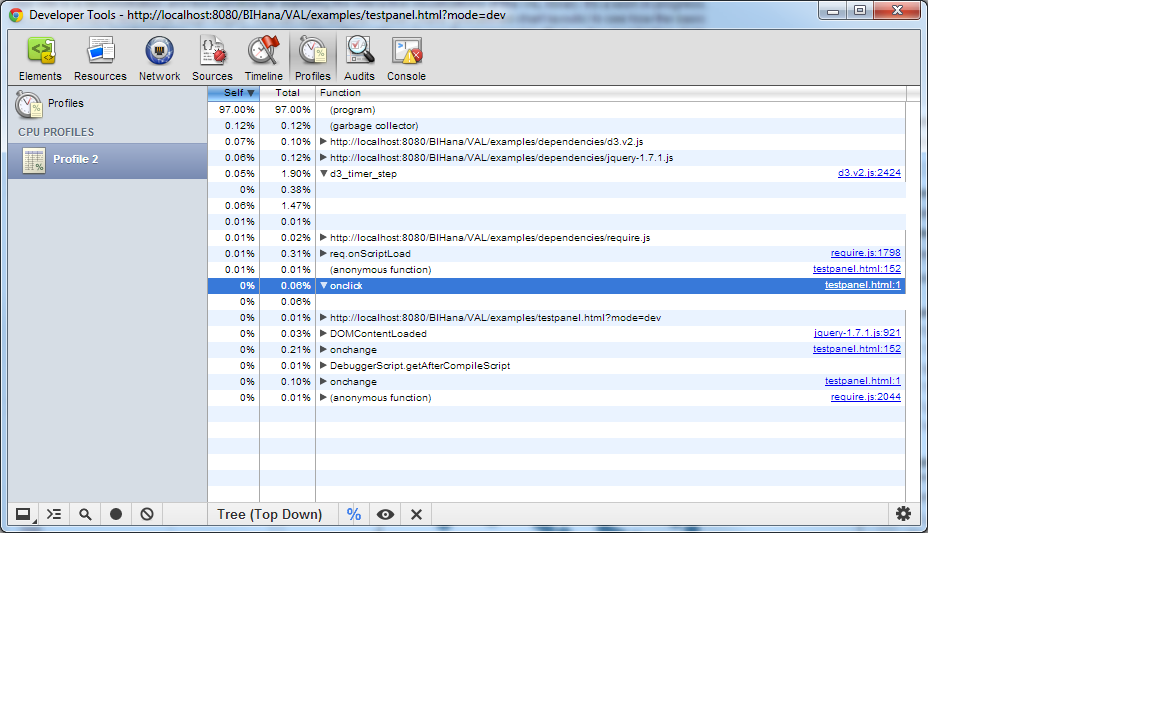
Basically, what happens is after the profiler stops it displays a list of functions in the "bottom up" view. When I click on the arrow next to any of the functions, the first click does nothing and then the second click does expand the selection but it just shows empty lines nested under the function. Sometimes there are "self" and "total" numbers next to the empty lines and sometimes not.
Same thing when I switch to "top down" view. First click on a function expand arrow does nothing and then the next click expands to nothing. As I switch back and forth between "top down" and "bottom up" I get a different view. Sometimes even the top-level functions are missing. It is very flaky.
Here's a screen shot showing the missing lines. You can see the d3_timer_step and the onclick functions expanded with empty lines under them:
As I said, for the first couple of simple runs this worked fine. But now I can't get back to that place anymore, even in the simplest cases. I've tried shutting the browser down completely and even creating a second profile with no extensions or anything but nothing works.
Is this something I'm doing wrong? Is there any way get around this? Or should I file a bug?
BTW, I'm using Version 22.0.1229.79 m on Windows 7 64-bit.
Cheers,
scott

Yury Semikhatsky
Oct 3, 2012, 6:12:29 AM10/3/12
to scott....@sap.com, google-chrome-...@googlegroups.com
You are doing all right. I filed a bug on this: https://bugs.webkit.org/show_bug.cgi?id=98250
I cannot reproduce the problem on tip-of-tree build, so as a work around I would recommend using canary build of Chrome(you can download it here https://tools.google.com/dlpage/chromesxs) which can be installed in parallel with the stable version you have.
Yury
scott....@sap.com
Oct 3, 2012, 11:54:16 AM10/3/12
to google-chrome-...@googlegroups.com, scott....@sap.com
On Wednesday, October 3, 2012 3:12:31 AM UTC-7, Yury Semikhatsky wrote:
You are doing all right. I filed a bug on this: https://bugs.webkit.org/show_bug.cgi?id=98250I cannot reproduce the problem on tip-of-tree build, so as a work around I would recommend using canary build of Chrome(you can download it here https://tools.google.com/dlpage/chromesxs) which can be installed in parallel with the stable version you have.Yury
Thanks, Yury. Canary works like a charm. I actually didn't realize you could install this side-by-side so cleanly. That's fantastic

jay...@gmail.com
Nov 2, 2012, 4:32:11 PM11/2/12
to google-chrome-...@googlegroups.com, scott....@sap.com
Thanks for posting a bug on this. I am seeing the exact same problem in Chrome Version 22.0.1229.94 m on Windows 7 64-bit, but Canary works great.
Reply all
Reply to author
Forward
0 new messages