Setting CP and W' correctly for Athlete (V3.1)
5,033 views
Skip to first unread message

Troy
Apr 6, 2015, 5:00:03 PM4/6/15
to golden-che...@googlegroups.com
I'm new to training with power and Golden Cheetah, and am unclear on if I have my athlete stats set up correctly. I have done an FTP test and set my CP is set at 235 watts. I used the CP and W' estimator and it said CP is 235 and W' is 16000. When I set that, I see rides where W' Extended is 121 and red and see my W' Balance go negative.
So I'm curious if I have my settings correct or need to make adjustments. Any help would be wonderful. This software is brilliant and I want to make sure I'm using it correctly.
I'm attaching a ride from yesterday.
Thank you.

Nathan Townsend
Apr 7, 2015, 5:14:32 AM4/7/15
to golden-che...@googlegroups.com
I was just about to make a post on this, so thanks for starting the discussion for me!
Myself and Phil Skiba are about to submit a paper which examines the W'bal model in hypoxia. Basically what happens is that in hypoxia (we tested CP + W' in 13 cyclists at sea level and approx 2500m altitude), is that CP decreases markedly, but W' stays about the same. There is a recent paper which shows that for subjects whom decrease their CP more at altitude, they might even have an increase in W' at altitude. I'm not 100% convinced this a true physiological effect as opposed to an artifact of test/retest variability though.
Next we did an intermittent task to exhaustion, again both at sea level and altitude. What happens is that if you use the CP + W' values obtained from testing at sea level, but then you apply these parameter inputs to the W'bal and exercise at altitude, essentially what you're doing is overestimating CP but holding W' about the same. In this case, we saw a massive overestimation in W'bal eg: some subjects were reaching exhaustion with 8-9 kJ left in the tank!
What is happening here is easy to understand. If your CP is set too high, then W' depletes much more slowly than it should during any interval performed above your true CP. W'bal then also recovers more quickly than it should during the recovery period. Therefore it stays too high.
If W'bal goes negative, the opposite effect is occurring ie: CP is set too low, therefore W'bal depletes too quickly during the work interval and recharges too slowly during the recovery interval.
So lets asume you have a rough idea of what your CP + W' is from your field derived P(t) curve*. You can then easily tweak these values by doing your favourite standardised interval training session and make sure you go right to your absolute limit. Simply alter the CP value first, then recalculate W' using the new CP, then re-check your workout. when W'bal = 0 coincides with the point of fatigue, you're in the ballpark.
*Nb: the purpose of getting and estimate first is that the value of W' still is relevant, but in the W'bal model it appears to be of lesser importance than the value of CP. From a physiological perspective this also makes perfect sense and is consistent with the underlying mechanisms. So once you've established that either you're highly aerobic or anaerobic (or wherever in-between), only then should you marginally tweak the CP value (and recalculate W' accordingly) to dial in the W'bal model. If the W'bal model works properly, then there is a very strong chance your parameter inputs are also accurate.
Nathan Townsend
Apr 7, 2015, 5:21:06 AM4/7/15
to golden-che...@googlegroups.com
On Tuesday, 7 April 2015 00:00:03 UTC+3, Troy wrote:
I'm new to training with power and Golden Cheetah, and am unclear on if I have my athlete stats set up correctly. I have done an FTP test and set my CP is set at 235 watts. I used the CP and W' estimator and it said CP is 235 and W' is 16000. When I set that, I see rides where W' Extended is 121 and red and see my W' Balance go negative.
As a caveat to my above post, the problem here is simple...... DO NOT USE FTP AS YOUR CP INPUT. FTP is too low and therefore W'bal goes negative.
When you say you did an "FTP test" what do you mean by that? Exactly what did you do? If you did a 20min TT for example, then just use 20MMP as your CP and forget the arbitrary 95% fudge factor which has been comprehensively debunked in the scientific literature.
Troy
Apr 7, 2015, 2:37:44 PM4/7/15
to golden-che...@googlegroups.com
Nathan, thanks for your response. For my FTP "Test" I did a hill climb near my house. Easy warm up then 20 minutes as hard as I could go. Since it was my first time I now know I didn't pace myself and went out too hard at the beginning. My average watts for that 20 min was 248 and I did take that number x .95 as my CP (235). Should I set my CP to 248? How do I determine what my W' should be?
Thank you.

Steve Tucker
Apr 7, 2015, 5:24:50 PM4/7/15
to golden-che...@googlegroups.com
I don't wish to hijack this thread but it is on topic.
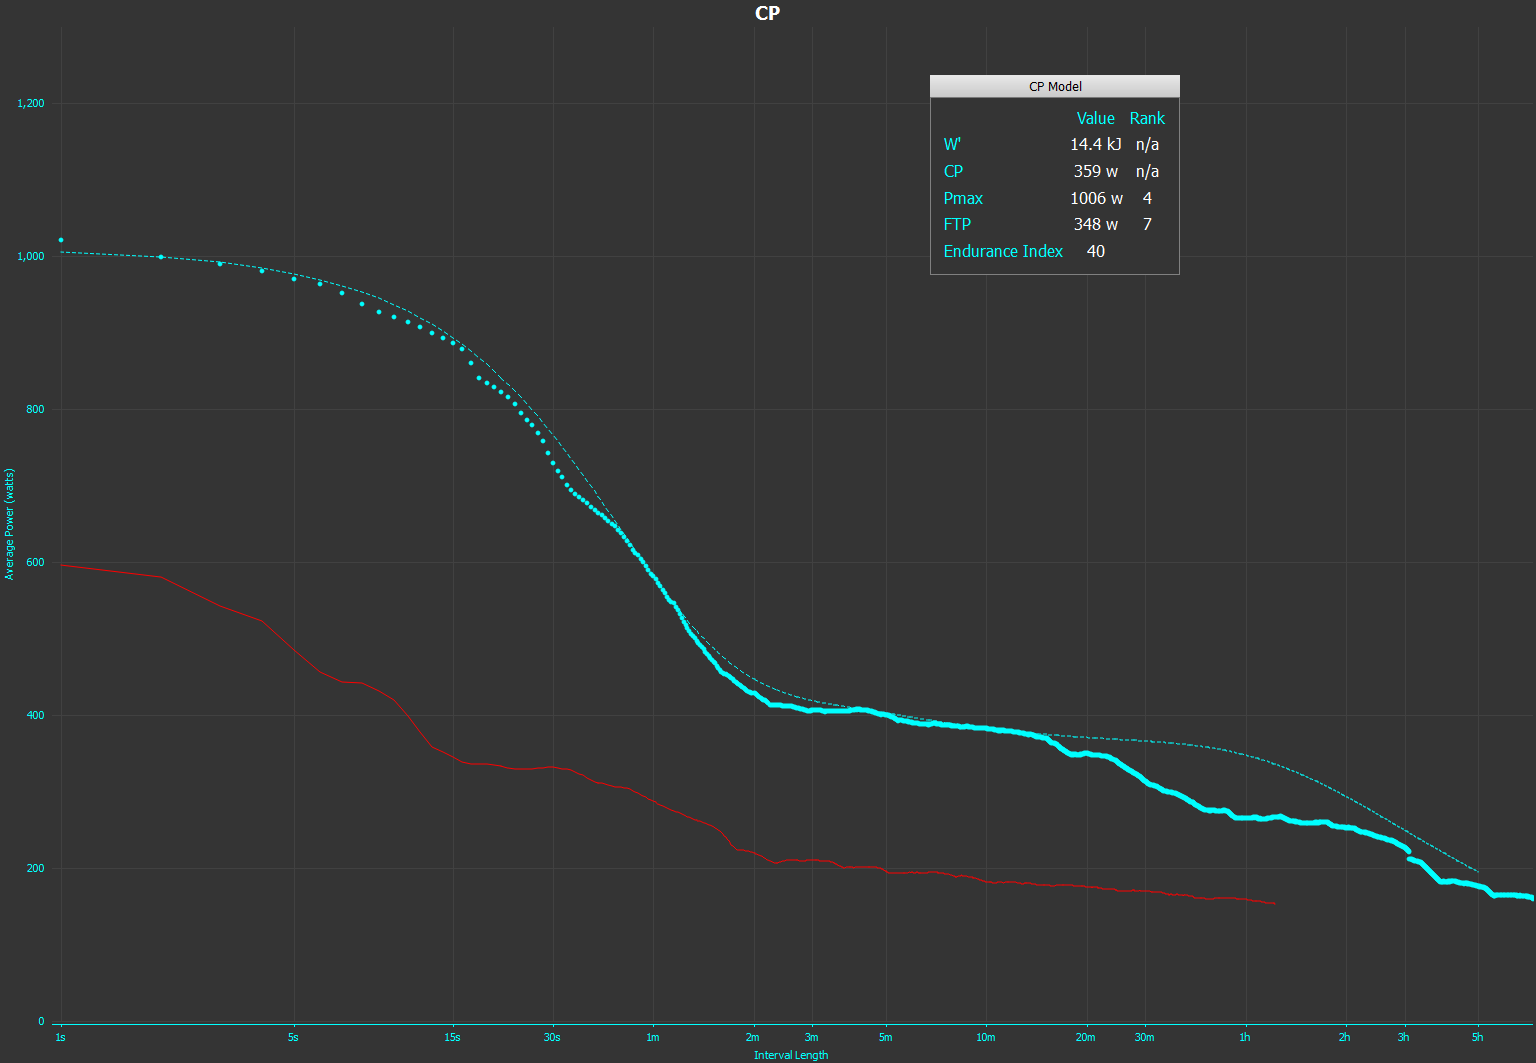
I have been using GC for a few months now, did an ftp test 20mins x 95% and manually set my CP to 315, my W' was set as per the CP model at 24kJ
This all seemed to make sense however recently I did a 20 min best of 350w, strangely (to me anyway) the CP model is now giving CP as 359 and FTP as 348 and W' has reduced to 14.4 kJ. As I had not manually adjusted my CP I was getting W'expended figures in the red and negative W'Bal. The stress chart was telling me I needed a minimum W of 248 so I adjusted to this, but now I a still geting negative W Bal and a mimum CP of 366 which has to be incorrect. Im really not sure how to adjust this now to get something accurate?
Thanks
Steve

mike veloclinic
Apr 8, 2015, 1:08:29 AM4/8/15
to golden-che...@googlegroups.com
Steve can you post up your veloclinic plot with CP set at the different levels ?
Nathan Townsend
Apr 8, 2015, 1:33:49 AM4/8/15
to golden-che...@googlegroups.com
This is a response for you both yourself Steve and Troy.
Your true CP is much closer to a TT effort in the range 20-30mins. There are multiple papers which indicate this, in fact there is an entire body of scientific literature spanning decades that leads to this conclusion. You should throw the 95% correction factor out the window and simply set your CP either at your 20MMP or even do a 30MMP test also and take the average. This should be a fairly narrow range anyway. You don't need to stop there though. You can then tweak this value by doing workouts to complete exhaustion and test the W'bal model. As stated, if the W'Bal goes severaly negative eg: >1.5 kJ then adjust the CP upwards in 5W increments and recalculate. Same goes for the opposite. If you W'bal at complete exhaustion is >1.5 kJ then slightly decrease the CP and recalculate.
The problem with doing a TT only of course is that you do not establish W'. Therefore you're better off doing 3-5 TTs in the range 3-15mins. I'll write a more detailed description in a new thread later today about a what I would consider a "gold standard" method to determine CP + W' in addition to some practical modifications that would work better out on the road.
Nathan Townsend
Apr 8, 2015, 1:35:50 AM4/8/15
to golden-che...@googlegroups.com
On Wednesday, 8 April 2015 08:08:29 UTC+3, mike veloclinic wrote:
Steve can you post up your veloclinic plot with CP set at the different levels ?
bte Mike I need to spend some time on this. For anyone who knows the "veloclinic plot", it is a brilliant idea and Mike.... you NEED to get it in print in a proper journal!!
Steve Tucker
Apr 8, 2015, 9:57:15 AM4/8/15
to golden-che...@googlegroups.com
Mike
Thanks, I am using GC 3.1 atm, I assume I need 3.2 for this and cannot see where to d/l it if i do but happy to post my plots if I can get to them.
Nathan
My recent best 20MMP was on a 7 k climb in Majorca if that counts. I guess there is some higher and some lower efforts but the average was 350w, so you are suggesting I think that going on this I should set my CP in GC to 350 at least as a starting point. OK two such efforts would be better and take the average. What I really don't understand is what to do with W' and why it suddenly dropped in the model from 24 to 14.4 kJ?
With my CP adjusted to 345 and my W' to the same as the model at 14.4 I now only have one ride which shows W' expended in red at 167 and of course this is now the only ride that drops into the negative in the Stress chart.
I apologise for being a bit dense but I am just a rider who loves using GC to train and want to get my head round it a bit more.
Thanks again for your time in replying
Nathan Townsend
Apr 8, 2015, 12:56:43 PM4/8/15
to golden-che...@googlegroups.com
On Wednesday, 8 April 2015 16:57:15 UTC+3, Steve Tucker wrote:
MikeThanks, I am using GC 3.1 atm, I assume I need 3.2 for this and cannot see where to d/l it if i do but happy to post my plots if I can get to them.NathanMy recent best 20MMP was on a 7 k climb in Majorca if that counts. I guess there is some higher and some lower efforts but the average was 350w, so you are suggesting I think that going on this I should set my CP in GC to 350 at least as a starting point. OK two such efforts would be better and take the average. What I really don't understand is what to do with W' and why it suddenly dropped in the model from 24 to 14.4 kJ?With my CP adjusted to 345 and my W' to the same as the model at 14.4 I now only have one ride which shows W' expended in red at 167 and of course this is now the only ride that drops into the negative in the Stress chart.I apologise for being a bit dense but I am just a rider who loves using GC to train and want to get my head round it a bit more.Thanks again for your time in replying
Testing on a hill is a tricky one. Most of us know from experience that it is possible to sustain slightly higher power on a hill than on the flat. One contributing factor for this is because we engage slightly more muscle mass during hill climbing which improves torque production throughout the entire pedal revolution. I think it is best to conduct CP testing on a false flat if possible. It then becomes slightly more applicable to various terrain.
W' drops because CP is higher. Simple as that. If you can sustain 400w for 5min and you change your CP from 300 to 320, then W' must be lower to compensate.
When you say W'bal went to 167 in the red, this is in joules. The best data we have at present is from Phil's 2014 field validation paper which indicates a threshold value of 1.5 kJ ie: 1500 joules. So it looks pretty sharp to me! if you're pushing to -ve 2 or 3 kJs then its time to readjust CP + W'.
This is how you should realise that you're getting fitter over time. If you set CP + W' properly and you find it is within +/- 1.5 kJ of zero at fatigue, then all good. Over time if you find that you can gradually drop if further into the red, then you are getting fitter. Hard to know which component has changed without further testing though.
mike veloclinic
Apr 8, 2015, 2:30:31 PM4/8/15
to golden-che...@googlegroups.com
Steve,
Yes the VC plot with the adjustable CP is in the development build. You can also do it manually in an excel spreadsheet and plot power vs W' work which is total work - cp*time. If you attach a CSV with your Power Duration data I can set that up for you if its not making sense.
mike
Steve Tucker
Apr 8, 2015, 3:09:05 PM4/8/15
to golden-che...@googlegroups.com
Nathan
Many thanks, that makes a lot of sense to me and I now have a clearer picture of the relationship between CP and W.
The 167 in red I meant as W' expended (%) which I assume is 167%.
On this one ride alone I am recording -9348.3 W' Balance (kJ) on the stress chart which tells me minimum CP is 366. This was on a 6k climb on an otherwise flat ride where I buried myself.
On all other rides W'Bal now remains positive, even on the ride I mentioned previously where I recorded a 20 min best W' drops to a minimum of +861 W' Bal (kJ)
Cheers
Steve
Mike veloclinic
I'm afraid I have no idea how to even find my power duration data, let alone how to enter it into excel.
Sorry
Regards
Steve

Pete from AUS
Apr 8, 2015, 6:43:31 PM4/8/15
to golden-che...@googlegroups.com
Steve
On an MMP chart, click the 'settings' icon and selct 'export chart data'.
You'll then have the underlying data in an Excel CSV file.
Do an equation to multiply the time (seconds) by power to give you "work" for each time point.
Pete
Steve Tucker
Apr 9, 2015, 12:26:04 PM4/9/15
to golden-che...@googlegroups.com
Pete from AUS, thanks for that.
mike veloclinic
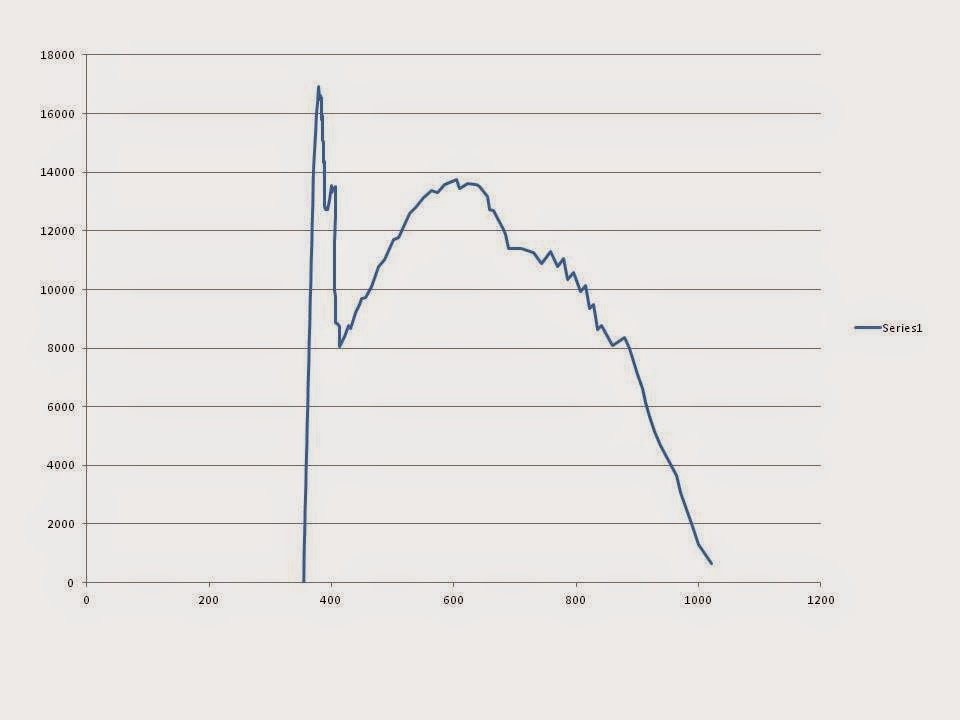
OK here goes, the attached files are from the MMP and the PMC, a 01 denotes the previous CP of 315 and a 02 denotes after adjustment from 25 March CP to 345
If you need any other info please just ask.
many thanks
Steve
mike veloclinic
Apr 10, 2015, 1:31:23 AM4/10/15
to golden-che...@googlegroups.com
Steve,
You almost got it. The Power Duration curve or Mean Maximal Power Curve is the chart with the best power that you can sustain plotted against time. I attached a jpeg screenshot of what it looks like. In Golden Cheetah you want to be under the Activities view with your most recent ride selected. Then open up the chart with the curve I think Golden Cheetah calls it the Critical Power Chart (I renamed mine PD). Once you have that chart open, click on More in the upper left, click all chart settings and check the box for Show Bests, then click done. Click on More again and then select More again and click export chart data and save it as a .csv .
mike
Steve Tucker
Apr 10, 2015, 3:13:00 AM4/10/15
to golden-che...@googlegroups.com
Mike
Thanks, I shall sort this out and post after work this evening (UK)
Steve
mike veloclinic
Apr 11, 2015, 2:48:40 AM4/11/15
to golden-che...@googlegroups.com
Steve,
In the Critical Power valid region of your Power Duration curve you have a linear rather than hyperbolic (asymptotic) shape which means that the CP model will not fit this data well.
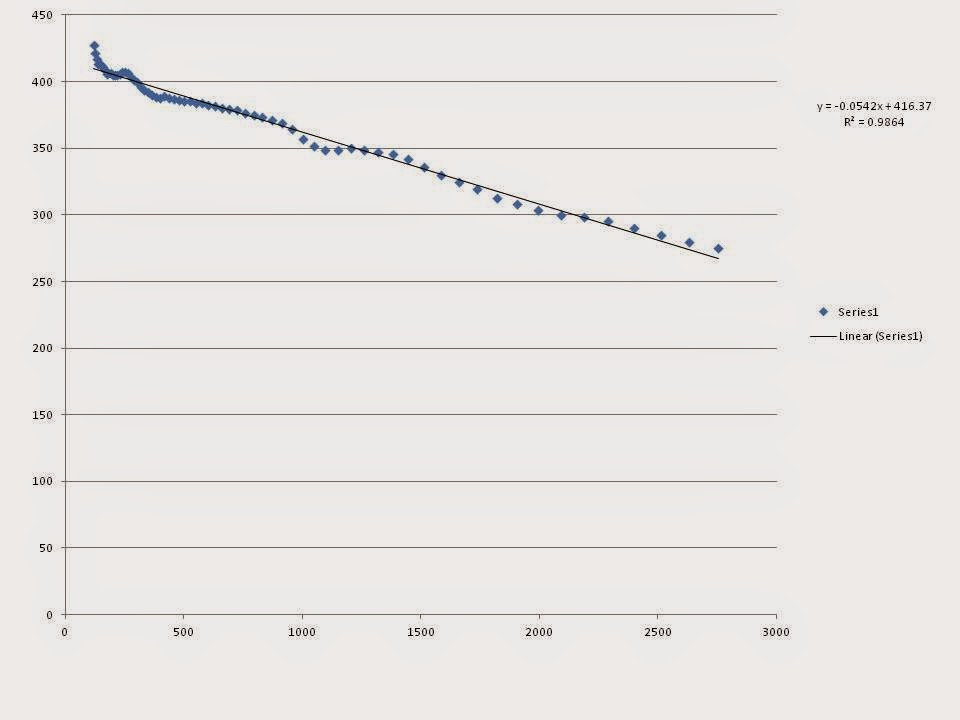
Taking a look at the VC plot and searching between 300 and 360 watts its not possible to find enough peaks to get a clear W' plateau.
I tried scrubbing your data with an algorithm to find local high quality data points but still ended up with a linear rather than hyperbolic shape.

Your best bet is to do some specific testing to sort out what is going on with your curve. I suspect that you may not have true maximal efforts on the shorter 2-7 minute end of the CP valid region. If you like using the climb then hit several efforts fresh with a good spread of durations.
Attached is an excel file set up to make the Veloclinic plot. You can paste in the updated PD data and then manually adjust the CP to test how well
Mike
On Wednesday, April 8, 2015 at 6:57:15 AM UTC-7, Steve Tucker wrote:
Steve Tucker
Apr 11, 2015, 5:12:47 AM4/11/15
to golden-che...@googlegroups.com
Thanks for your efforts on this Mke, I have not done any shorter specific all out tests, relying on ride data to fill in the gaps. I guess I had better get on with that then.
Regards
Steve
Reply all
Reply to author
Forward
0 new messages