Setting y range with bars
7,319 views
Skip to first unread message

Winston Chang
Apr 23, 2012, 2:38:56 AM4/23/12
to ggplot2-dev
Hi everyone -
Someone just asked me a question about changing the y-min on a bar graph. When you use ylim() or scale_y_continuous(limits=xxx), of course, the bars disappear. The usual answer is to use coord_cartesian(ylim=xxx) instead.
I discovered that you can also use scale_y_continuous(limits=xxx, oob=rescale_none). Is this considered an OK way to do it? I find that the coord/scale limits thing is not very intuitive for ggplot2 users (including me sometimes!)
dat <- data.frame(x=c("A","B"), y=c(10,12))
p <- ggplot(data=dat, aes(x=x, y=y)) + geom_bar()
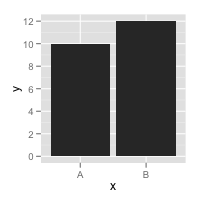
# Normal version
p
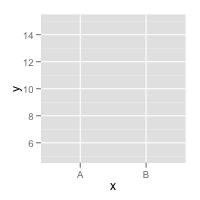
# No visible bars
p + scale_y_continuous(limits=c(5, 15))
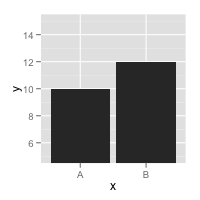
# Visible bars with oob=rescale_none
p + scale_y_continuous(limits=c(5, 15), oob=rescale_none)
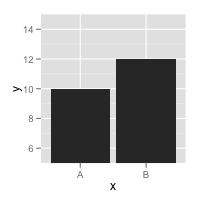
# Visible bars with coord_cartesian
p + coord_cartesian(ylim=c(5,15))
-Winston

Hadley Wickham
Apr 26, 2012, 9:38:40 AM4/26/12
to Winston Chang, ggplot2-dev
On Mon, Apr 23, 2012 at 12:38 AM, Winston Chang <winsto...@gmail.com> wrote:
> Hi everyone -
>
> Someone just asked me a question about changing the y-min on a bar graph.
> When you use ylim() or scale_y_continuous(limits=xxx), of course, the bars
> disappear. The usual answer is to use coord_cartesian(ylim=xxx) instead.
>
> I discovered that you can also use scale_y_continuous(limits=xxx,
> oob=rescale_none). Is this considered an OK way to do it? I find that the
> coord/scale limits thing is not very intuitive for ggplot2 users (including
> me sometimes!)
I think using squish would be canonical.
> Hi everyone -
>
> Someone just asked me a question about changing the y-min on a bar graph.
> When you use ylim() or scale_y_continuous(limits=xxx), of course, the bars
> disappear. The usual answer is to use coord_cartesian(ylim=xxx) instead.
>
> I discovered that you can also use scale_y_continuous(limits=xxx,
> oob=rescale_none). Is this considered an OK way to do it? I find that the
> coord/scale limits thing is not very intuitive for ggplot2 users (including
> me sometimes!)
And this is a valid use, but it does create a deceiving graph.
Hadley
--
Assistant Professor / Dobelman Family Junior Chair
Department of Statistics / Rice University
http://had.co.nz/
Winston Chang
Apr 26, 2012, 12:17:23 PM4/26/12
to Hadley Wickham, ggplot2-dev
> Someone just asked me a question about changing the y-min on a bar graph.I think using squish would be canonical.
> When you use ylim() or scale_y_continuous(limits=xxx), of course, the bars
> disappear. The usual answer is to use coord_cartesian(ylim=xxx) instead.
>
> I discovered that you can also use scale_y_continuous(limits=xxx,
> oob=rescale_none). Is this considered an OK way to do it? I find that the
> coord/scale limits thing is not very intuitive for ggplot2 users (including
> me sometimes!)
And this is a valid use, but it does create a deceiving graph.
I'm just wondering about how, in general, one should go about zooming in on a graph -- by using scale limits with oob=rescale_none, or with coord transforms. Both work but I think from a user's point of view, modifying the scale is less confusing.
Here's a simple example where squish can have bad consequences:
# Plot with a single segment
dat <- data.frame(x=1, xend=5, y=1, yend=2)
p <- ggplot(dat, aes(x=x, xend=xend, y=y, yend=yend)) + geom_segment()
p
# Shrink x range with default oob=censor: no segment
p + scale_x_continuous(limits=c(1,2))
# With squish, line changes slope
library(scales)
p + scale_x_continuous(limits=c(1,2), oob=squish)
# With rescale_none, it looks OK
p + scale_x_continuous(limits=c(1,2), oob=rescale_none)
# With coord_cartesian, it looks OK
p + coord_cartesian(xlim=c(1,2))
-Winston
Hadley Wickham
Apr 26, 2012, 1:43:41 PM4/26/12
to Winston Chang, Hadley Wickham, ggplot2-dev
Using the coord is definitely the best way. But it might be worth considering if changing scale limits should work like coords by default.
--
Sent from my iPhone
Hadley
--
Sent from my iPhone
Winston Chang
Apr 26, 2012, 4:09:21 PM4/26/12
to Hadley Wickham, ggplot2-dev
In my opinion, it makes sense for the default behavior for scale_x_continuous to NOT drop out-of-range values (oob=rescale_none). I think in most cases, if users want that data to be clipped, they'd rather do it themselves, or explicitly specify the value of oob.
The current default behavior of scale_colour_continuous seems good to me.
Hadley Wickham
Apr 27, 2012, 8:01:22 AM4/27/12
to Winston Chang, ggplot2-dev
> In my opinion, it makes sense for the default behavior for
> scale_x_continuous to NOT drop out-of-range values (oob=rescale_none). I
> think in most cases, if users want that data to be clipped, they'd rather do
> it themselves, or explicitly specify the value of oob.
I think that makes sense too. The current behaviour is confusing, and
> scale_x_continuous to NOT drop out-of-range values (oob=rescale_none). I
> think in most cases, if users want that data to be clipped, they'd rather do
> it themselves, or explicitly specify the value of oob.
it's rarely desired. We might also think about having an explicit
out-of-bounds flag for non-positions scales.
Could you please file an issue and assign it to 0.10? We can discuss
potential changes in more depth when we get closer to that release.
Thanks!
Reply all
Reply to author
Forward
0 new messages