Flutter DevTools 2.0 Release

Kenzie Schmoll
Flutter DevTools 2.0 Release Notes
A Suite of Performance Tools for Dart and Flutter
General Updates
Fixed lifecycle management issues causing problems when disconnecting and reconnecting to applications
Fixed bug with app wide settings not persisting
Added persistent, draggable scrollbars to charts and tables
Delete fallback to html version of the app - this was triggering on false positives for issues that were not actually canvaskit failures
Use lazy lists for flat data tables (logging view, network requests, etc.)
Inspector Updates
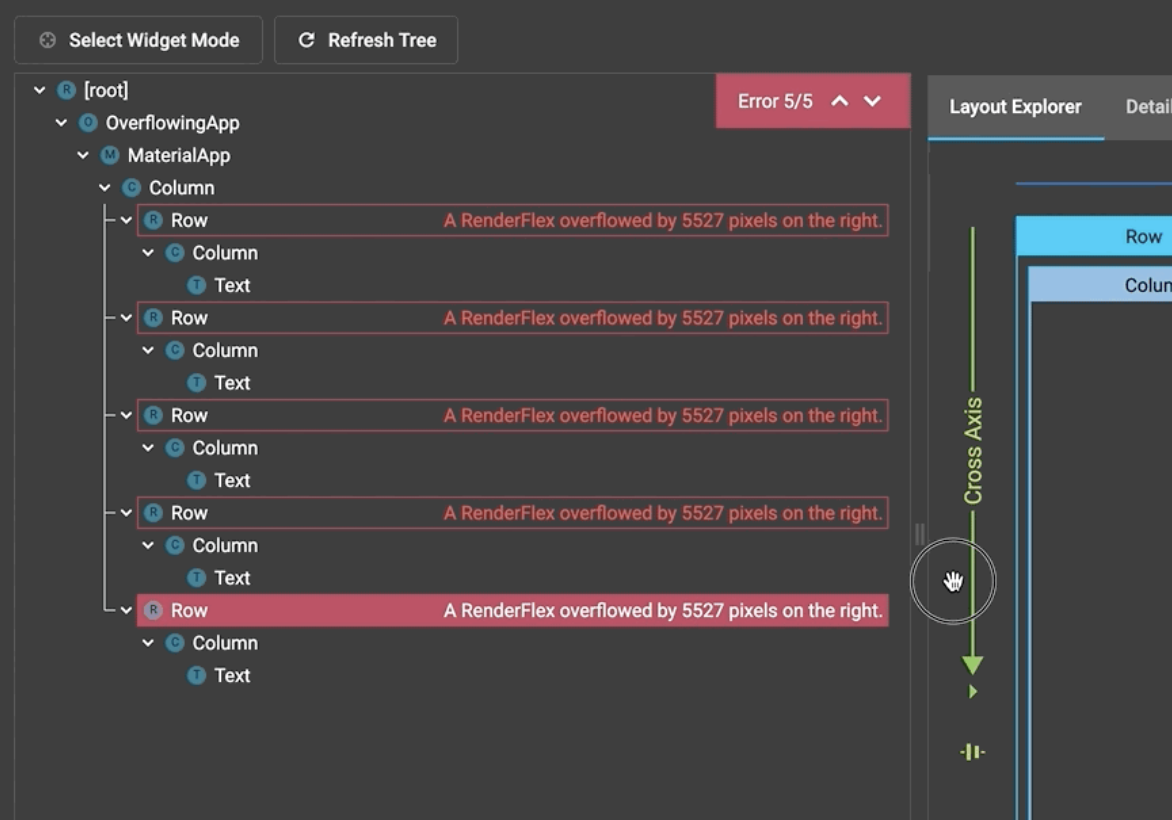
Added an error navigator that allows you to navigate through “errored” widgets in your widget tree. As you use the previous and next arrows to navigate through the errored widgets, the details view (either the Layout Explorer or the Details Tree) will update to the respective errored widget, allowing you to debug the issue with the tool.
Bug fixes and improvements to the Layout Explorer
Performance Updates
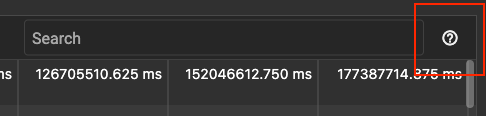
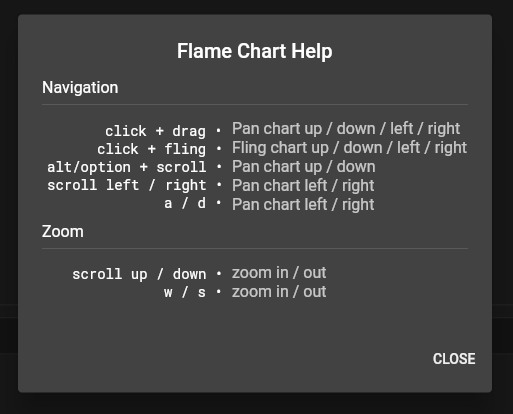
Added a help dialog to flame charts describing how to interact with the chart
Fixed a bug with w-a-s-d key navigation and zoom in flame charts
Polished scrolling behavior in flame charts to prevent bounce back at the bounds of the scroll view.
CPU Profiler Updates
Fixed a bug with arrow key navigation in tree tables that was causing jumpy scrolling behavior
Memory Updates
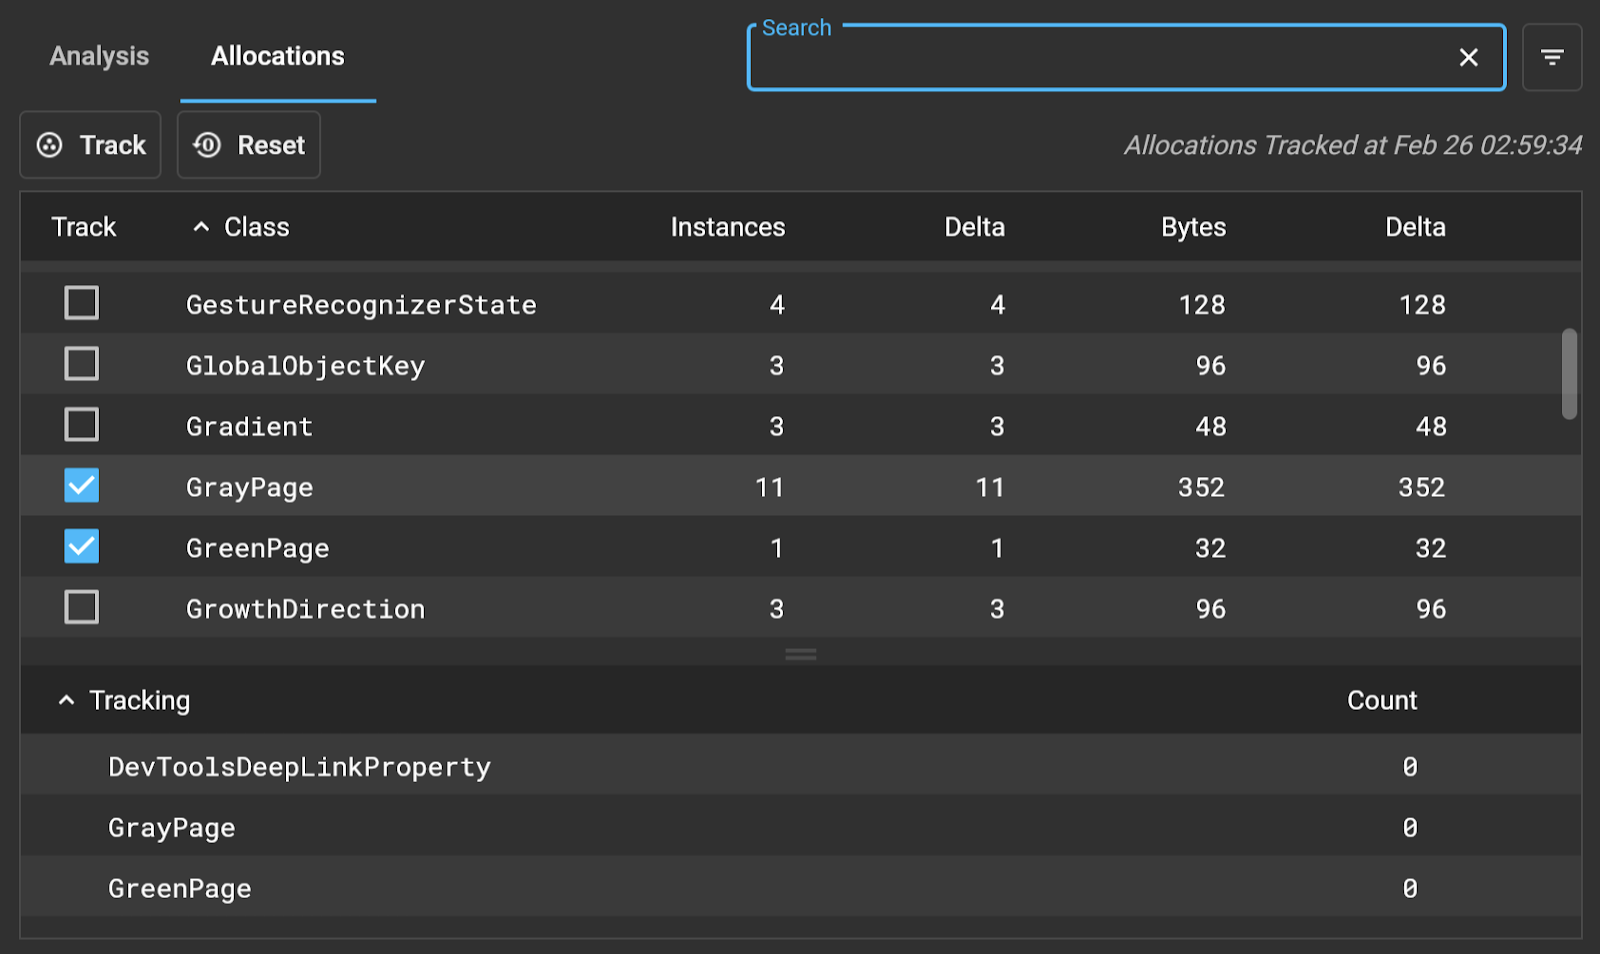
Improved data organization and UX for the heap snapshot and allocation monitoring information. There are now two tabs: “Analysis” and “Allocations”. In the Analysis tab, you can see information for heap snapshots and analyses collected from those snapshots. You can drill down into the data using the tree table, and select an object instance to inspect the object and it’s fields.
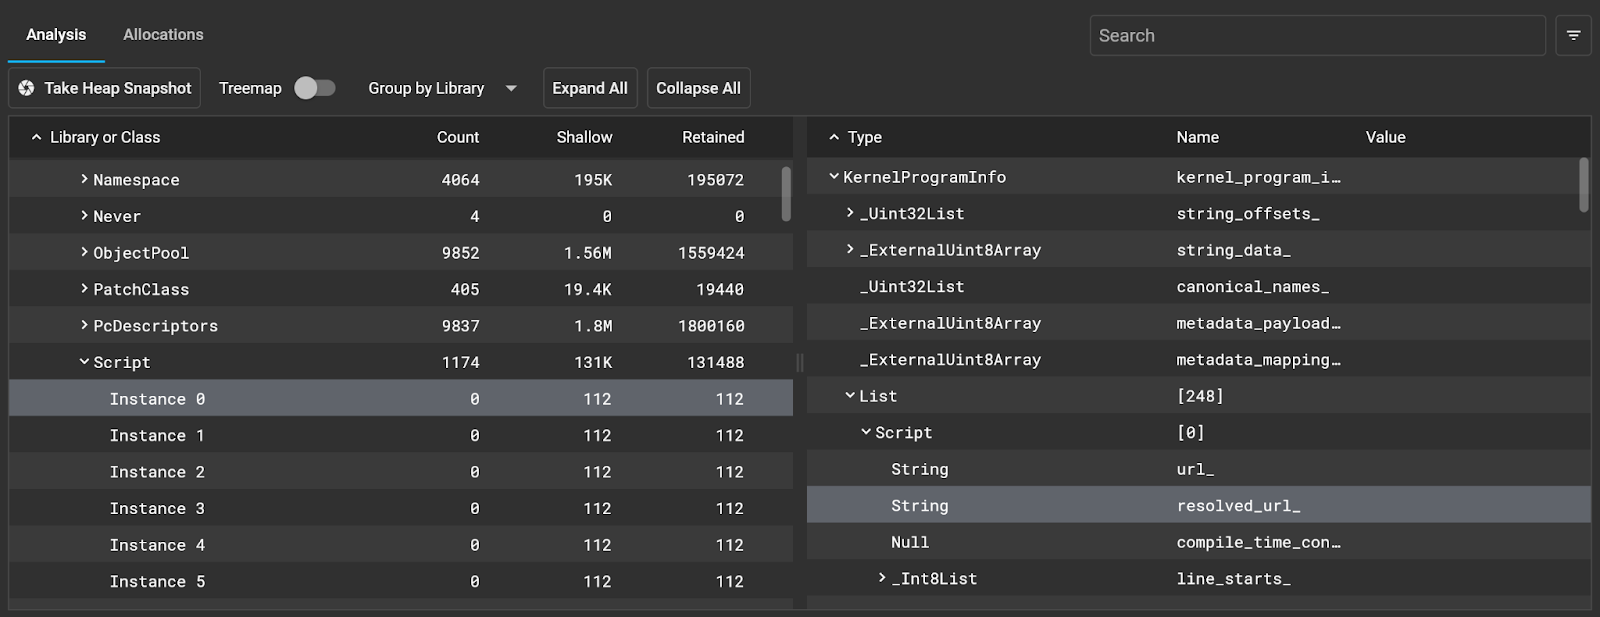
You can still use the other functions like search, filter and grouping as you would have before this change. Press the Treemap toggle to view the snapshot data in a treemap interface instead of a table.
The allocation monitoring feature is now in its own tab: “Allocations”. This information is independent of the heap snapshot data.
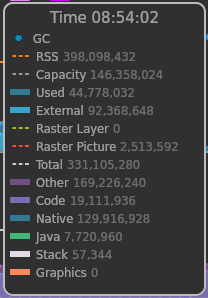
Bug fixes and UI improvements to event timeline hover card
Bug fixes and improvements to search and auto-complete functions
Fixed bug causing Null types to show up as expandable objects
Fixed bug causing duplicate data entries while expanding and collapsing
Debugger Updates
Added support for expandable object inspection in the debugger console
Added support for single line text selection in the source view
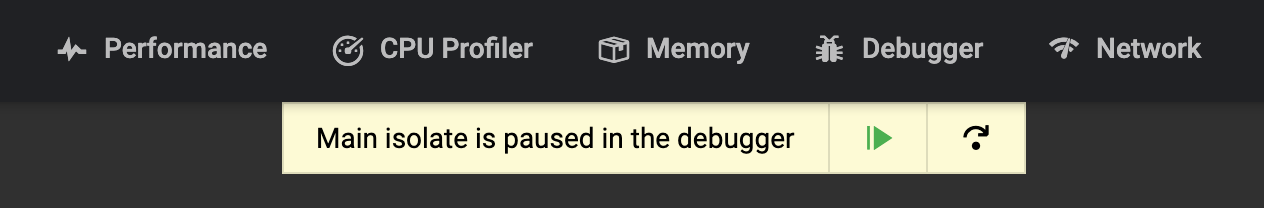
Added floating debugger control to both notify you when your app is paused and allow resuming and stepping from other pages of DevTools
Fixed a bug where stepping buttons did not work after refreshing the DevTools page
Bug fixes and improvements to syntax highlighting in the source view
Updated debugger control icons to be consistent with VS Code
Removed “Show All” button from Call Stack window. We instead request the first twelve frames (twelve is arbitrary - we limit the number for performance reasons), and request the remaining frames in the background once the first 12 are displayed.
Network Profiler Updates
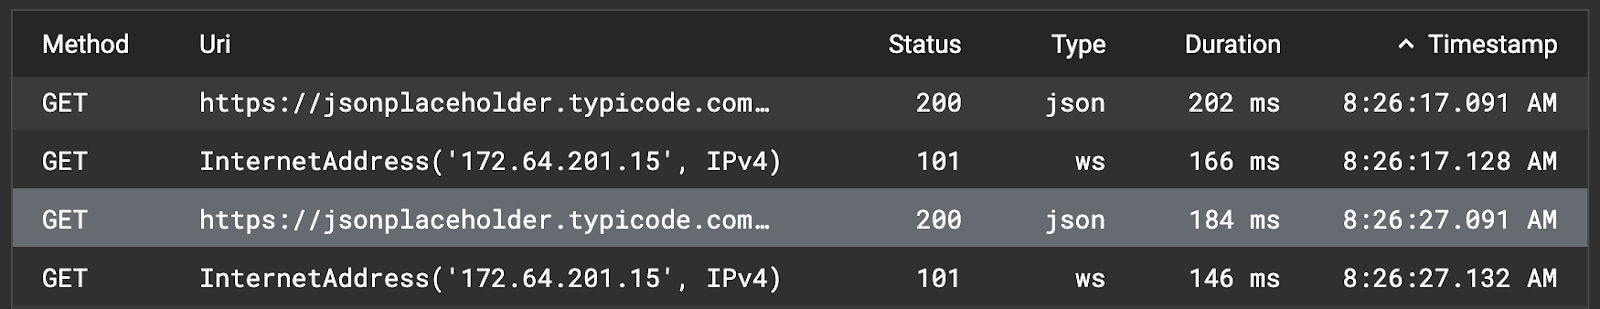
Added selection styling to network requests table
Changelog
More details about changes and fixes are available in our changelog.