Need help migrating from v0.8.3
259 views
Skip to first unread message

Joel DeWitt
Aug 22, 2019, 4:17:24 PM8/22/19
to Flot graphs
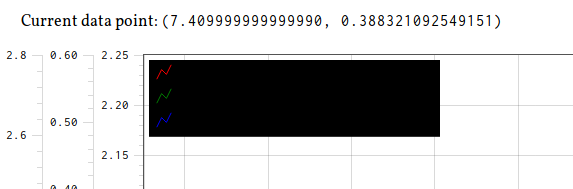
I am in the process of migrating from the ancient v0.8.3 (before active development stopped) to a more recent version of Flot. Everything appears to be straightforward, except for two items. First, a legend now looks like this:
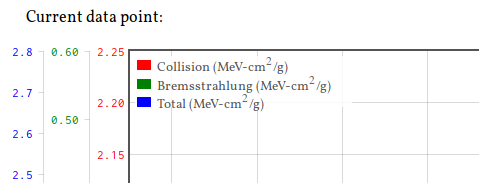
Here is how it correctly appears under the old version:
Second, notice also how the tick labels are no longer colored. Here is the code relevant for the above screenshot:
function Flot(dEdx_c_plot, dEdx_b_plot, dEdx_plot) {
  'use strict';
  $.plot('#placeholder', [
    {
      data: dEdx_c_plot,
      label: 'Collision (MeV-cm$^2$/g)',
      yaxis: 1,
      color: 'red'
    },
    {
      data: dEdx_b_plot,
      label: 'Bremsstrahlung (MeV-cm$^2$/g)',
      yaxis: 2,
      color: 'green'
    },
    {
      data: dEdx_plot,
      label: 'Total (MeV-cm$^2$/g)',
      yaxis: 3,
      color: 'blue'
    }
  ], /*options*/
    {
      xaxis: { axisLabel: 'Kinetic Energy (MeV)' },
      yaxes: [
        { font: { color: 'red' }, position: 'left' },
        { font: { color: 'green' }, position: 'left' },
        { font: { color: 'blue' }, position: 'left' }
      ],
      legend: { show: true, position: 'nw', labelBoxBorderColor: null },
      series: { lines: { show: true } },
      grid: { hoverable: true, clickable: true }
    });
  hoverFlot();
}
I have tried looking at the examples of course to possibly see what changes are required--no luck. Any advice you can offer in fixing these problems will be most appreciated. Thank you!

andre...@ni.com
Aug 26, 2019, 9:27:15 AM8/26/19
to Flot graphs
To color the labels on the axes you now use css. Try
.flot-y1-axis {
fill: red;
}
For the other axes change y1 to the appropriate number.
I do not know why the legend is black - what exact version are you using?
mtower
Aug 26, 2019, 1:54:28 PM8/26/19
to Flot graphs
What item to be aware of Joel is that the way the legend is generated changed after v0.8.3. The old way used an html table (which should have been a list instead). The new way; however, uses svg or canvas only to draw the legend. As such the styling has changed including removal of the old colored "checkbox" and instead uses non interactive svg icons.
Joel DeWitt
Aug 27, 2019, 9:10:59 AM8/27/19
to Flot graphs
That worked beautifully, thank you. I'm still tracking down the problem with the legend--possibly some SVG conflict. I'll let you know what I turn up. As for the version, it claims v3.0.0, though I don't believe it. I'm just using the GitHub ZIP, so who knows...
andre...@ni.com
Aug 27, 2019, 9:14:20 AM8/27/19
to Flot graphs
We now build and deploy packages to npm. That is now the best place to find flot. The latest version from npm is 3.2.9.
Joel DeWitt
Sep 10, 2019, 8:50:07 AM9/10/19
to Flot graphs
I now have v3.2.9 via npm and following these instructions. The issue with the black legend still persists. I tried commenting out my CSS to test whether there is some cross-talk (interference) there, but no dice. As an aside, $.plot.version still reports v3.0.0. The same is true for the examples online:
Joel DeWitt
Sep 10, 2019, 8:51:57 AM9/10/19
to Flot graphs
Question: is there a CSS class I can target to address the legend background directly?
On Tuesday, August 27, 2019 at 9:14:20 AM UTC-4, andrew.dove wrote:

Jonathan Meyer
Sep 13, 2019, 11:23:55 AM9/13/19
to Flot graphs
A CSS selector of 'legendLayer > background' will point to a 'rect' element.
Joel DeWitt
Sep 18, 2019, 5:18:01 PM9/18/19
to Flot graphs
Thank you for replying.
I'm clearly doing something wrong. I tried .legendLayer { background: white } in my CSS with no success. Aside: I've already tried legend: { backgroundColor: 'white' } as the API directs ... didn't work.
Jonathan Meyer
Sep 18, 2019, 5:50:29 PM9/18/19
to Flot graphs
Sorry, the previous CSS I supplied wasn't quite right. You should be able to add the following to your CSS file:
.legendLayer .background {
fill: rgba(255, 255, 255, 0.85);
stroke: rgba(0, 0, 0, 0.85);
stroke-width: 1;
}
This is what is supplied in our examples.css file.

Ced
Sep 19, 2019, 11:31:49 AM9/19/19
to Flot graphs
This seems like a good opportunity for Flot to set sane defaults when creating the <rect> element. Added benefit is that it wouldn't require additional CSS rules unless user wanted to customize.
This line (https://github.com/flot/flot/blob/master/source/jquery.flot.legend.js#L48) can be updated to include a style attribute according to this documentation. https://developer.mozilla.org/en-US/docs/Web/SVG/Attribute/style
html[j++] = '<rect class="background" width="100%" height="100%" style="fill: rgba(255, 255, 255, 0.85); stroke: rgba(0, 0, 0, 0.85); stroke-width: 1;"/>';Joel DeWitt
Sep 19, 2019, 8:36:19 PM9/19/19
to Flot graphs
Thank you for that clarification. That worked wonderfully. In retrospect I should have consulted the example CSS first...
By the way, how would one go about fixing this clipping issue?
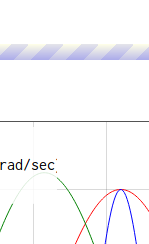
There is supposed to be a closing parentheses there. (This doesn't happen in all cases, just in some.) Sorry, I'm not great with SVG...
Ced
Sep 19, 2019, 11:25:15 PM9/19/19
to Flot graphs
Sorry, I posted this before my coffee. I realized later this suggestion won't work but perhaps there's another way to set the default fill on the SVG/canvas.
Reply all
Reply to author
Forward
0 new messages