Firebug 2.0.2
367 views
Skip to first unread message

Jan Honza Odvarko
Jul 18, 2014, 5:21:30 AM7/18/14
to fir...@googlegroups.com

Tim Ryan
Jul 18, 2014, 10:51:21 AM7/18/14
to fir...@googlegroups.com
Confirming that the Net tab issue wrt to filtering cached responses is fixed in this version.
Thanks!
On Friday, July 18, 2014 4:21:30 AM UTC-5, Jan Honza Odvarko wrote:
Thanks!
On Friday, July 18, 2014 4:21:30 AM UTC-5, Jan Honza Odvarko wrote:
https://blog.getfirebug.com/2014/07/18/firebug-2-0-2/
Honza

Lomikar
Jul 18, 2014, 2:53:45 PM7/18/14
to fir...@googlegroups.com
Hi Honza;
Breakpoints seem still to have issues:
1: The code vs breakpoints panes are getting out of sync.
2. Spinner sometimes doesn't go away.
3: And now function keys F8, F10, F11 and Ctrl/Shift+F11 don't do anything. Same by clicking on them in UI.
Thank you
Lumir

Sebastian Zartner
Jul 21, 2014, 3:49:31 AM7/21/14
to fir...@googlegroups.com
Do you have test cases for these three points, so we can reproduce the problem?
Does the problem go away, if you create a new profile and just install Firebug in it?
Sebastian
Does the problem go away, if you create a new profile and just install Firebug in it?
Sebastian

Brian Merz
Jul 23, 2014, 3:24:59 PM7/23/14
to fir...@googlegroups.com
This is fixed when a new profile is created and Firebug installed there.
Sebastian Zartner
Jul 25, 2014, 4:08:31 AM7/25/14
to fir...@googlegroups.com
Ok, so it's either related to the profile settings or a conflict with other extensions. Can you please investigate this further following the steps described in our first aid page?
Sebastian
Sebastian

Richard Davies
Aug 8, 2014, 11:11:15 AM8/8/14
to fir...@googlegroups.com
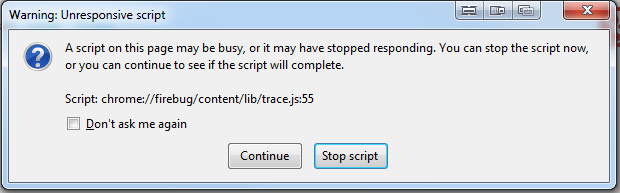
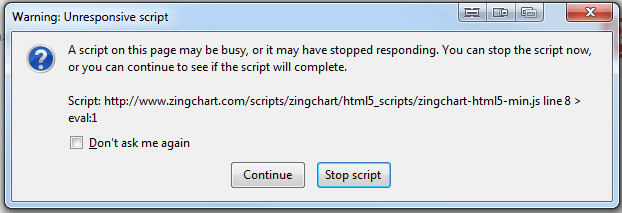
When the Firebug 2.0.2 script panel is enabled, it's causing extremely slow page loads (60+ seconds) and one or more "Unresponsive script" warnings to appear when loading a page that contains the ZingChart JavaScript library (ex. http://www.zingchart.com/gallery/). This issue wasn't present in v2.0.1.
Sebastian Zartner
Aug 8, 2014, 5:02:19 PM8/8/14
to fir...@googlegroups.com
Thanks for the test case. I can reproduce that issue and reported it here:
https://code.google.com/p/fbug/issues/detail?id=7621
Sebastian
https://code.google.com/p/fbug/issues/detail?id=7621
Sebastian
Richard Davies
Aug 8, 2014, 5:14:30 PM8/8/14
to fir...@googlegroups.com
Thank you!

AJ123abc
Aug 12, 2014, 2:35:12 AM8/12/14
to fir...@googlegroups.com
I just installed fresh 2.0.2 version of firebug into a fresh new profile (I even re-installed Firefox version 31 fresh).
The line numbers and the code that is displayed in Firebug are NOT in sync.
PLEASE HELP.
PLEASE HELP.
Thank you so much in advance
AJ
AJ123abc
Aug 12, 2014, 2:51:08 AM8/12/14
to fir...@googlegroups.com
For me it continues to happen even with installing firebug (2.0.2) into a new profile... this was working fine with 2.0. I have a hard time finding from where I can go back to 2.0...?
Sebastian Zartner
Aug 12, 2014, 6:02:26 AM8/12/14
to fir...@googlegroups.com
There are some problems regarding dynamic script display within the Script panel in Firebug 2.0.2. Instead of switching back to an earlier version of Firebug I suggest you wait for the next bug fix release (which should be this or next week).
If you want to switch back anyway, you can find all Firebug versions on addons.mozilla.org.
Sebastian
If you want to switch back anyway, you can find all Firebug versions on addons.mozilla.org.
Sebastian
AJ123abc
Aug 12, 2014, 5:21:46 PM8/12/14
to fir...@googlegroups.com
Frankly, I am baffled as how this works for anyone else...? Everyone in my team has the same issue with 2.0.2 where line numbers are not in sync with the code and hence making debugging literally impossible. We have tried uninstall/re-install into new profile,etc. (using FF version 31).
Anyway... we have switched back to version 1.12.8.
Also another issue with 2.0 is that, when adding a new variable to watch (under watch tab) it used to get added at the top of the list, now it is added at the bottom and user has to scroll down. Usually, you want to see the most recent added variables to watch at the top.
Regards,
Sebastian Zartner
Aug 13, 2014, 3:14:53 AM8/13/14
to fir...@googlegroups.com
On Tuesday, August 12, 2014 11:21:46 PM UTC+2, AJ123abc wrote:
Frankly, I am baffled as how this works for anyone else...? Everyone in my team has the same issue with 2.0.2 where line numbers are not in sync with the code and hence making debugging literally impossible. We have tried uninstall/re-install into new profile,etc. (using FF version 31).
Could it be that besides posting here you also created issue 7625?
What do you actually mean with "line numbers are not in sync with the code"? Is it the same as described in issue 7615? If not, please provide a test case, so it can be reproduced what you mean.
What do you actually mean with "line numbers are not in sync with the code"? Is it the same as described in issue 7615? If not, please provide a test case, so it can be reproduced what you mean.
Also another issue with 2.0 is that, when adding a new variable to watch (under watch tab) it used to get added at the top of the list, now it is added at the bottom and user has to scroll down. Usually, you want to see the most recent added variables to watch at the top.
AJ123abc
Aug 14, 2014, 6:53:12 PM8/14/14
to fir...@googlegroups.com
I just upgraded to 2.0.3, and I still see the issue where line numbers are not in sync with the actual code.
That is for example:
1: var x = 1;
2: if (x == 1) {
3: someFunction(x);
In the debugger I see line 2 as being grayed out thus not able to set a break point on that line, But can do so on line 3. Except when the break point happens on line 3, it is actually executing line 2 (the IF statement).
This problem started happening in 2.0.2 and now in 2.0.3. It has impacted all my team badly. We keep switching back to 1.12.8, except FF magically keeps upgrading us to the latest version of firebug (in spite of the fact we have specified NOT to upgrade us automatically)!
Sebastian Zartner
Aug 18, 2014, 5:13:18 PM8/18/14
to fir...@googlegroups.com
I put your code into a simple test case, which I attached to this post. Using Firefox 31.0 + Firebug 2.0.3 on Win8.1.
The lines are correctly marked as executable, I can set a breakpoint at the line containing if (x == 1) { and it also gets it when I reload the page.
I assume you have a syntax error within your script. When there is a syntax error within a script, you may not be able to set a breakpoint in it. So please check whether there are any JavaScript errors shown within the Console panel (ensure you have the option Show JavaScript Errors checked).
If you can exclude syntax errors as the cause, please provide a complete test case and describe the steps to reproduce the problem.
Sebastian
Sebastian Zartner
Aug 18, 2014, 5:18:54 PM8/18/14
to fir...@googlegroups.com
except FF magically keeps upgrading us to the latest version of firebug (in spite of the fact we have specified NOT to upgrade us automatically)!
Did you uncheck the option Update Add-ons Automatically within the Add-ons Manager?
Sebastian
Sebastian
AJ123abc
Aug 19, 2014, 1:20:57 AM8/19/14
to fir...@googlegroups.com
Thanks Sebastian...
Attached please find the screen shot of firebug version 2.0.3 where line numbers and code lines are not in sync.
I have show JavaScript errors, show css Errors, show JavaScript warnings turned on. No errors are displayed in console (hence I assume there are no errors).
And yet this is what I see in the debugger (please see attached file).
I really do not know how to reproduce the issue short of submitting our entire project (which we can not).
In the meantime we are switching back to 1.12.8.
Please advise.
Kindest Regards,
AJ
Reply all
Reply to author
Forward
0 new messages