*[Enwl-eng] [can-eecca] Fwd: [CAN-talk] climate legacy from 2017

ENWLine
As we enter 2018, another decisive year for climate change policies, there are a few key events and indicators that shaped 2017 and pave the challenges ahead for us and the wider climate justice and clean energy community and movement. Certainly, these indicators are not exclusive but are essential components of our messaging as to whether the glass is half-full or half-empty or both depending on the issue.
While the UNEP Emissions Gap report in late October already indicated that today we are further away than ever from a 2030 trajectory towards an eventual 2-degree and 1.5-degree pathway, it also showed at same time that the vast technical (and economic) opportunities to cut GHG emissions by 2030 in all sectors significantly to achieve these pathways are also the largest ever. Because of rapid cost decline and resulting technology uptake in daily use. One recent example shows the exponential uptake of highly efficient LED lighting globally. A technology that costed truly a fortune about 5 years ago and that was nowhere by then http://news.ihsmarkit.com/press-release/energy/leds-took-half-billion-tons-carbon-dioxide-sky-2017-ihs-markit-says
CO2 emissions reductions by use of LED with about 570 Mt CO2 in 2017 compared to conventional lighting were close to those of all wind power with about 640 Mt CO2 in 2016.
Despite these positive developments, there are true planetary and other indicators that unfortunately put things into a different context and show us the dire realities of 2017:
- Global CO2 emissions
As reported earlier, in 2017 we likely have seen the highest ever man-made total CO2 emissions to the atmosphere of about 41 Gt CO2 as well as one of the historically largest annual growth rates of 2% higher of energy- and industry-related CO2, representing a growth of about 750 Mt CO2 compared to 2016. Total energy- and industry-related CO2 amounted to c. 37 Gt CO2, the single largest source of GHG emissions.
While these still preliminary findings point to China as the largest reason with its CO2 emissions growth of 3.5% in the country, mainly from coal and oil, CO2 output approx. stagnated in Europe and US and also grew in all other countries.
What many of us had hoped that a peak of at least energy-related CO2 as the most important GHG emission sector had been reached over the last three years with the growth of renewables and enhanced investments into energy efficiency, this was not sufficient to curtail the growth of fossil fuel CO2 again in 2017…..

Source: https://phys.org/news/2017-11-global-carbon-dioxide-emissions-stable.html
- Atmospheric CO2 concentrations
The latest atmospheric CO2 recording (3rd Jan) confirms the unbroken trend of rapidly surging CO2 concentrations as a result of CO2 emissions to the atmosphere to ever higher levels since at least 800,000 years (no ice core data available before that) and likely higher than half a dozen millions of years – or even longer…..Atmospheric CO2 concentration had been growing with about 0.6 ppm annually on average since about 1700, but more or less exponentially since the 50s of last century with about 2-3 ppm on average resulting from the also growing amount of fossil fuel use.

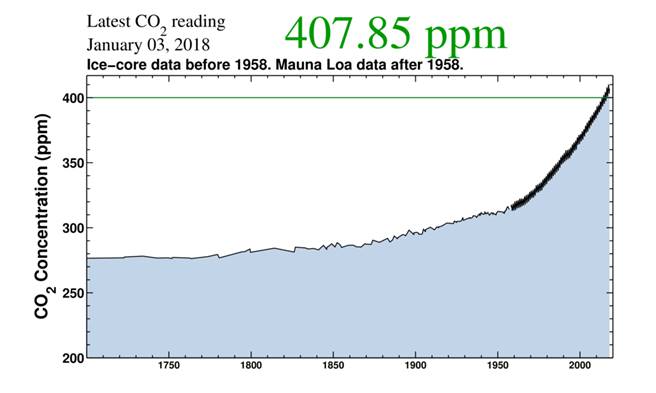
Source: https://www.co2.earth/daily-co2
- Global temperatures
CO2 emissions, the consequential atmospheric CO2 concentrations and the resulting surface/atmospheric temperatures are the interdependent triangle of factors that enforce each other`s strength though they might fluctuate annually. So it is no surprise that record CO2 emissions and atmospheric concentrations resulted again in a very warm year. According to the series of the last about 40 years of low troposphere atmospheric temperatures across the globe, 2017 was the third-warmest year of all after the El-Nino years 2016 and 1998
https://www.newswise.com/articles/global-temperature-report:-december-2017 .
Almost identical, according to NASA (below) which analysed surface temperatures, 2017 was the warmest non-El Nino year and the second warmest of all since reliable temperature readings occurred across the globe.

- Global weather-related damages
Although the `attribution science` is growing very fast and is now increasingly able to indicate the likely contribution of global warming factors to an observed extreme event, no one can say at this point in time of science as to whether one single extreme weather event was triggered by global warming/climate change or other natural fluctuations. Also, assessed costs of certain weather-related damages depend on where they occur and what is included because a flood in low-income Bangladesh is “cheaper” than in high-income Florida. Further, coverage of weather-related disasters by insurance is much more comprehensive in OECD and by the richer part of the population than in other nations or the poorer parts of people anywhere. Still, the trend of costs and of numbers of weather-related disasters for insurances in accordance with growing CO2 concentrations and temperatures are a very good proxy for the rapidly growing risks, costs and impacts of climate change.
As Munich RE said January 4, 2018: “ Roughly 93% of all events worldwide in 2017 were weather-related disasters. The macroeconomic impact was in the region of US$ 320bn, of which some US$ 133bn was insured. This makes 2017 the costliest year ever in terms of global weather disasters. “
Similarly, the numbers of catastrophic weather-related disasters had been growing significantly as well since 1980.

And the biggest losses (insured and non-insured) in 2017 occurred in the hurricane season in US and the Caribbean Islands

Sources: https://www.munichre.com/topics-online/en/2018/01/2017-year-in-figures,
Cheers
Stephan
Dr Stephan Singer
Senior Advisor Global Energy Policies
Climate Action Network International
Email: ssi...@climatenetwork.org
Skype: Stephan080458
Mobile: + 32 (0) 496 55 07 09
Brussels/Belgium

-- CAN-talk Listserv | CAN-...@listi.jpberlin.de | https://listi.jpberlin.de/mailman/listinfo/can-talk | Emails received through CAN-talk are confidential and should not be circulated beyond CAN members unless otherwise stated. -- Subscribe to CAN's ECO Newsletter @ http://climatenetwork.org/eco-newsletters --
Date: 2018-01-05 11:18 GMT+00:00
Subject: [CAN-talk] climate legacy from 2017
------------- * ENWL * ------------
Ecological North West Line * St. Petersburg, Russia
Independent Environmental Net Service
Russian: ENWL (North West), ENWL-inf (FSU), ENWL-misc (any topics)
English: ENWL-eng (world information)
Send information to en...@lew.spb.org, enwl...@lew.spb.org, en...@lew.spb.org, en...@lew.spb.org
Subscription, Moderator: vf...@lew.spb.org or en...@enw.net.ru
Archive: http://groups.google.com/group/enwl/
Additionally: http://www.enwl.net.ru/
(C) Please refer to exclusive articles of ENWL
-------------------------------------