Performance test results
337 views
Skip to first unread message

Benjamin Angelaud
Jul 27, 2016, 10:03:40 AM7/27/16
to Druid User
Hey guys,
I ran some tests and can't explain the metrics result. Any help is appreciate !
Tests on datasource "visits", 1 segment (1 shard) per day (~400-500MB) 96 dimensions 6 metrics
QueryType: Timeseries on 6 metrics (2 HyperUnique, 2 LongSum, 1 DoubleSum)
1 broker node: c4.4xlarge
1 historical node: r3.8xlarge (32 cores with actually 31 workers in conf)
query on 7 days (7 segments):
user: 2359ms
Historical query/time: 2292ms
max(Historical query/segmentAndCache/time): 2283ms
avg(Historical query/segmentAndCache/time): 2081ms
query on 30 days (30 segments):
user: 5717ms
Historical query/time: 5649ms
max(Historical query/segmentAndCache/time): 5640ms
avg(Historical query/segmentAndCache/time): 4635ms
(other metrics are not relevant)
The fact is query/segmentAndCache/time give us "Milliseconds taken to query individual segment or hit the cache (if it is enabled on the historical node)."
The max time of this metric is expected to be the same between both queries, but we can clearly see that in the second query it take more than twice the time.
My historical has 31 worker, so he's able to scan and compute 31 segments in parallel. I expected the time added in the second query came from merging, but it seems like .. NO !
Thanks guys,
Ben

Fangjin Yang
Jul 29, 2016, 8:19:00 PM7/29/16
to Druid User
Hmmm, that seems odd. Can you post the query/segment/time times?
Benjamin Angelaud
Aug 1, 2016, 4:31:28 AM8/1/16
to Druid User
Hey Fangjin,
The cache was disable, so the query/segment/time times are equals to query/segmentAndCache/time.
7 segments:
max(Historical query/segmentAndCache/time): 2283ms
avg(Historical query/segmentAndCache/time): 2081ms
(1826;1904;1979;2151;2194;2229;2283)
30 segments:
max(Historical query/segmentAndCache/time): 5640ms
avg(Historical query/segmentAndCache/time): 4635ms
(3627;3858;3858;3965;4043;4063;4208;4225;4459;4513;4540;4559;4570;4677;4698;4741;4761;4777;4829;4849;4857;4949;4986;5054;5013;5032;5143;5242;5329;5640)

Nishant Bangarwa
Aug 1, 2016, 6:27:33 AM8/1/16
to Druid User
Hi Benjamin,
could you also share your historical jvm config and runtime.properties for more details ?
--
You received this message because you are subscribed to the Google Groups "Druid User" group.
To unsubscribe from this group and stop receiving emails from it, send an email to druid-user+...@googlegroups.com.
To post to this group, send email to druid...@googlegroups.com.
To view this discussion on the web visit https://groups.google.com/d/msgid/druid-user/d7601fd7-c897-4fc3-b144-f425213af7be%40googlegroups.com.
For more options, visit https://groups.google.com/d/optout.
Message has been deleted
Benjamin Angelaud
Aug 1, 2016, 9:19:47 AM8/1/16
to Druid User
Historical/runtimes.properties
druid.service=druid/historical
druid.port=8083


# HTTP server threads
druid.server.http.numThreads=50


# Processing threads and buffers
druid.processing.buffer.sizeBytes=1073741824
druid.processing.numThreads=31


# Segment storage
druid.segmentCache.locations=[{"path":"var/druid/segment-cache","maxSize"\:300000000000}]
druid.server.maxSize=300000000000


# GroupBy queries


druid.query.groupBy.maxIntermediateRows=60000000
druid.query.groupBy.maxResults=24000000


# Caching


druid.cache.type=memcached
druid.cache.hosts=<memcachedHost>
#druid.cache.type=local
druid.historical.cache.useCache=true
druid.historical.cache.populateCache=true
druid.historical.cache.unCacheable=["select"]


# Monitoring


druid.monitoring.monitors=["com.metamx.metrics.JvmMonitor","io.druid.client.cache.CacheMonitor"]
Jvm.config
-server
-Xmx12g
-Xms12g
-XX:NewSize=6g
-XX:MaxNewSize=6g
-XX:MaxDirectMemorySize=32g
-XX:+UseConcMarkSweepGC
-XX:+PrintGCDetails
-XX:+PrintGCTimeStamps
-Duser.timezone=UTC
-Dfile.encoding=UTF-8
-Djava.io.tmpdir=var/tmp
-Djava.util.logging.manager=org.apache.logging.log4j.jul.LogManager
Amazon ec2 -> r3.8xlarge
Benjamin Angelaud
Aug 8, 2016, 3:19:28 AM8/8/16
to Druid User
Any idea ?
Nishant Bangarwa
Aug 8, 2016, 5:36:50 AM8/8/16
to Druid User
Hi Benjamin,
Few observations/questions -
- you mentioned the cache was disabled during above results, but the runtime.props have set it to true, please confirm that cache was disabled when the numbers were taken ?
- server.maxSize is set 300G, I assume the historical was actually loading less data and all data is being served from memory, is this correct ?
- What is the difference that you see when you execute a Timeseries with 1 count aggregator over 1 week and 1 month of data.
- I guess the slowness when querying 31 segments in parallel can also be due to possible increase in GC pressure on historical. can you also monitor and compare gc activity when executing both a week and a month long query. If this is the case, gc tuning might help.
Cheers,
Nishant
On Mon, 8 Aug 2016 at 12:49 Benjamin Angelaud <be.an...@gmail.com> wrote:
Any idea ?
--
You received this message because you are subscribed to the Google Groups "Druid User" group.
To unsubscribe from this group and stop receiving emails from it, send an email to druid-user+...@googlegroups.com.
To post to this group, send email to druid...@googlegroups.com.
To view this discussion on the web visit https://groups.google.com/d/msgid/druid-user/131650a9-5de1-4ee0-8668-218f8ffff8d9%40googlegroups.com.
Message has been deleted
Benjamin Angelaud
Aug 9, 2016, 10:15:17 AM8/9/16
to Druid User
Hey Nishant,
- Yes, the cache is disable at query time with the "context" parameters
- My historical node is a r3.8xlarge with 244 Go of memory so i guess everything is in memory. Any way to check ?
- Timeseries with longSum on Count aggregator: 1 week: ~200ms, 1 month: ~300ms
- I guess not seeing the results below, what's your point of view about this ?

Thanks,
Ben

Gian Merlino
Aug 9, 2016, 12:17:07 PM8/9/16
to druid...@googlegroups.com
Hey Ben,
I wonder if what's going on is that r3.8xlarges don't actually have 32 cores, they have 32 hyperthreads. So past 16 concurrent scans you wouldn't necessarily expect the performance curve to be linear. Does that bear out in reality – do you find that the curve is linear up until 16 and then sub-linear?
Fwiw, there is also a patch in master (https://github.com/druid-io/druid/pull/3314) that improves HLL performance and GC pressure by reducing allocations.
Gian
--
You received this message because you are subscribed to the Google Groups "Druid User" group.
To unsubscribe from this group and stop receiving emails from it, send an email to druid-user+unsubscribe@googlegroups.com.
To post to this group, send email to druid...@googlegroups.com.
To view this discussion on the web visit https://groups.google.com/d/msgid/druid-user/613835d1-bf9d-4205-b8dd-d2b745422c0e%40googlegroups.com.

charles.allen
Aug 9, 2016, 12:44:29 PM8/9/16
to Druid User
https://aws.amazon.com/ec2/virtualcores/ shows 16
I *think* this is across two sockets (judging by physical ID reported in proc/cpuinfo) so the only thing that would REALLY scale linearly is if you had a cpuset defined such that 1, 2, 4, 8 threads all ran on the same physical socket without stepping on each other's hyperthreads.
Larger than that and you're going to have second order effects either cross socket (NUMA) or related to hyper threading
Benjamin Angelaud
Aug 11, 2016, 10:05:34 AM8/11/16
to Druid User
Thanks Gian and Charles for your precious help !


I ran into more tests, here's my results:
It seems like the scanning segment time is linear till 8 segments and then increase. Meaning r3.8xl can handle 8 scans at the same time i guess?!
I give you more test logs if it can helps anyone to do anything ;)
Cheers,
Ben
charles.allen
Aug 12, 2016, 3:43:49 PM8/12/16
to Druid User
This is really cool. Can you expand a bit on how the different measurements were collected?
Also, did you happen to collect query/cpu/time?
charles.allen
Aug 12, 2016, 3:46:59 PM8/12/16
to Druid User
Also, how much data is this expected to be churning through?
was there any warmup querying to make sure disk page cache wasn't the cause?
Benjamin Angelaud
Aug 16, 2016, 5:23:17 AM8/16/16
to Druid User
Hey Charles,
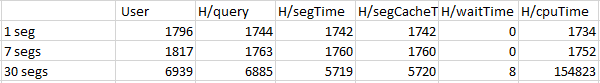
Query: Timeseries over nb seg with 2 hyperUnique, 2 longSum and 1 doubleSum metrics.
DataSource: 1 segment per day (~400-500MB) (~5-6 million rows)
For each nb seg, the query was executed 10 times, then each metric value is the average of this values for the 10 runs.
time(ms) represent the user time, cpu is query/cpu/time,query is query/time, seg is query/segment/time, segCache is query/segmentAndCache/time, wait is query/wait/time.
There is only Historical node metrics.
More infos needed ?!
charles.allen
Aug 16, 2016, 12:44:58 PM8/16/16
to Druid User
cool! any chance you can publish the data in tabular/text form?

Eric Tschetter
Aug 16, 2016, 1:27:19 PM8/16/16
to Druid User
Btw, I haven't caught up on this thread, but it came up in our dev
sync and I thought I would add some information about how to scale any
java-based data system on large boxes (Druid included).
Specifically, the recipe we've had for success is
1) Make sure that NUMA zone reclaim is turned off
(/proc/sys/vm/zone_reclaim_mode)
2) If using RHEL (not sure about other OSs): make sure that
transparent huge pages are set to never
(/sys/kernel/mm/redhat_transparent_hugepage)
3) Turn off biased locking on your JVM: (-XX:-UseBiasedLocking)
--Eric
> --
> You received this message because you are subscribed to the Google Groups
> "Druid User" group.
> To unsubscribe from this group and stop receiving emails from it, send an
> email to druid-user+...@googlegroups.com.
> You received this message because you are subscribed to the Google Groups
> "Druid User" group.
> To unsubscribe from this group and stop receiving emails from it, send an
> To post to this group, send email to druid...@googlegroups.com.
> To view this discussion on the web visit
> https://groups.google.com/d/msgid/druid-user/d4e038ac-db73-4f05-bac1-640315959a04%40googlegroups.com.
> To view this discussion on the web visit
Benjamin Angelaud
Aug 17, 2016, 8:43:08 AM8/17/16
to Druid User
Hey Eric,

Can you explain each point ?!
I tried to modify all of them but seems there is no changes. Except when the number of segments is under 16 (befor hypertheading i gues).
Take a look at this:
Where the "Série1" is y initial run and the "Série2" represents the same run after modifications you made.
Thanks,
Ben
Reply all
Reply to author
Forward
0 new messages