java.lang.OutOfMemoryError: GC overhead limit exceeded while starting historical node
2,574 views
Skip to first unread message

Shamshad Ahmed Khan
Aug 11, 2017, 12:48:20 PM8/11/17
to Druid User
Hello all
I am new to druid and I am facing serious issue while starting druid historical node. Please help me find out the reason behind it.
The log of historical node is as follows:
2017-30-11 06:30:49.519 [main] INFO io.druid.server.coordination.BatchDataSegmentAnnouncer - Announcing segment[c2mtable_3157_2017-08-04T18:00:00.000Z_2017-08-04T19:00:00.000Z_2017-08-04T18:00:41.133Z_10] at path[/druid/segments/10.0.1.115:8083/10.0.1.115:8083_historical__default_tier_2017-08-11T06:30:49.518Z_de05eeee710642f7a2ac801362427f25708]
2017-30-11 06:30:49.519 [main] INFO io.druid.server.coordination.BatchDataSegmentAnnouncer - Announcing segment[c2mtable_3609_2017-07-30T04:00:00.000Z_2017-07-30T05:00:00.000Z_2017-07-30T04:04:26.610Z_4] at path[/druid/segments/10.0.1.115:8083/10.0.1.115:8083_historical__default_tier_2017-08-11T06:30:49.518Z_de05eeee710642f7a2ac801362427f25708]
2017-30-11 06:30:49.519 [main] INFO io.druid.server.coordination.BatchDataSegmentAnnouncer - Announcing segment[c2mtable_908_2017-08-02T18:00:00.000Z_2017-08-02T19:00:00.000Z_2017-08-02T18:04:21.020Z_1] at path[/druid/segments/10.0.1.115:8083/10.0.1.115:8083_historical__default_tier_2017-08-11T06:30:49.518Z_de05eeee710642f7a2ac801362427f25708]
2017-30-11 06:30:50.259 [main] INFO io.druid.server.coordination.ZkCoordinator - Cache load took 3,269,178 ms
2017-30-11 06:30:50.260 [main] ERROR io.druid.cli.CliHistorical - Error when starting up. Failing.
java.lang.reflect.InvocationTargetException
at sun.reflect.NativeMethodAccessorImpl.invoke0(Native Method) ~[?:1.8.0_101]
at sun.reflect.NativeMethodAccessorImpl.invoke(NativeMethodAccessorImpl.java:62) ~[?:1.8.0_101]
at sun.reflect.DelegatingMethodAccessorImpl.invoke(DelegatingMethodAccessorImpl.java:43) ~[?:1.8.0_101]
at java.lang.reflect.Method.invoke(Method.java:498) ~[?:1.8.0_101]
at io.druid.java.util.common.lifecycle.Lifecycle$AnnotationBasedHandler.start(Lifecycle.java:364) ~[java-util-0.10.0.jar:0.10.0]
at io.druid.java.util.common.lifecycle.Lifecycle.start(Lifecycle.java:263) ~[java-util-0.10.0.jar:0.10.0]
at io.druid.guice.LifecycleModule$2.start(LifecycleModule.java:156) ~[druid-api-0.10.0.jar:0.10.0]
at io.druid.cli.GuiceRunnable.initLifecycle(GuiceRunnable.java:102) [druid-services-0.10.0.jar:0.10.0]
at io.druid.cli.ServerRunnable.run(ServerRunnable.java:41) [druid-services-0.10.0.jar:0.10.0]
at io.druid.cli.Main.main(Main.java:108) [druid-services-0.10.0.jar:0.10.0]
Caused by: java.lang.OutOfMemoryError: GC overhead limit exceeded
at java.util.Arrays.copyOf(Arrays.java:3236) ~[?:1.8.0_101]
at java.lang.StringCoding.safeTrim(StringCoding.java:79) ~[?:1.8.0_101]
at java.lang.StringCoding.access$300(StringCoding.java:50) ~[?:1.8.0_101]
at java.lang.StringCoding$StringEncoder.encode(StringCoding.java:305) ~[?:1.8.0_101]
at java.lang.StringCoding.encode(StringCoding.java:344) ~[?:1.8.0_101]
at java.lang.String.getBytes(String.java:918) ~[?:1.8.0_101]
at org.apache.logging.log4j.core.layout.AbstractStringLayout.getBytes(AbstractStringLayout.java:121) ~[log4j-core-2.5.jar:2.5]
at org.apache.logging.log4j.core.layout.AbstractStringLayout.toByteArray(AbstractStringLayout.java:148) [log4j-core-2.5.jar:2.5]
at org.apache.logging.log4j.core.appender.AbstractOutputStreamAppender.append(AbstractOutputStreamAppender.java:112) [log4j-core-2.5.jar:2.5]
at org.apache.logging.log4j.core.config.AppenderControl.tryCallAppender(AppenderControl.java:152) [log4j-core-2.5.jar:2.5]
at org.apache.logging.log4j.core.config.AppenderControl.callAppender0(AppenderControl.java:125) [log4j-core-2.5.jar:2.5]
at org.apache.logging.log4j.core.config.AppenderControl.callAppenderPreventRecursion(AppenderControl.java:116) [log4j-core-2.5.jar:2.5]
at org.apache.logging.log4j.core.config.AppenderControl.callAppender(AppenderControl.java:84) [log4j-core-2.5.jar:2.5]
at org.apache.logging.log4j.core.config.LoggerConfig.callAppenders(LoggerConfig.java:390) [log4j-core-2.5.jar:2.5]
at org.apache.logging.log4j.core.config.LoggerConfig.processLogEvent(LoggerConfig.java:378) [log4j-core-2.5.jar:2.5]
at org.apache.logging.log4j.core.config.LoggerConfig.log(LoggerConfig.java:362) [log4j-core-2.5.jar:2.5]
at org.apache.logging.log4j.core.config.LoggerConfig.log(LoggerConfig.java:352) [log4j-core-2.5.jar:2.5]
at org.apache.logging.log4j.core.config.AwaitCompletionReliabilityStrategy.log(AwaitCompletionReliabilityStrategy.java:63) [log4j-core-2.5.jar:2.5]
at org.apache.logging.log4j.core.Logger.logMessage(Logger.java:147) [log4j-core-2.5.jar:2.5]
at org.apache.logging.log4j.spi.AbstractLogger.logMessage(AbstractLogger.java:1016) [log4j-api-2.5.jar:2.5]
at org.apache.logging.log4j.spi.AbstractLogger.logIfEnabled(AbstractLogger.java:964) [log4j-api-2.5.jar:2.5]
at org.apache.logging.slf4j.Log4jLogger.info(Log4jLogger.java:178) [log4j-slf4j-impl-2.5.jar:2.5]
at io.druid.java.util.common.logger.Logger.info(Logger.java:72) [java-util-0.10.0.jar:0.10.0]
at io.druid.server.coordination.BatchDataSegmentAnnouncer.announceSegments(BatchDataSegmentAnnouncer.java:204) ~[druid-server-0.10.0.jar:0.10.0]
at io.druid.server.coordination.ZkCoordinator$BackgroundSegmentAnnouncer.finishAnnouncing(ZkCoordinator.java:592) ~[druid-server-0.10.0.jar:0.10.0]
at io.druid.server.coordination.ZkCoordinator.addSegments(ZkCoordinator.java:435) ~[druid-server-0.10.0.jar:0.10.0]
at io.druid.server.coordination.ZkCoordinator.loadLocalCache(ZkCoordinator.java:278) ~[druid-server-0.10.0.jar:0.10.0]
at io.druid.server.coordination.ZkCoordinator.start(ZkCoordinator.java:134) ~[druid-server-0.10.0.jar:0.10.0]
at sun.reflect.NativeMethodAccessorImpl.invoke0(Native Method) ~[?:1.8.0_101]
at sun.reflect.NativeMethodAccessorImpl.invoke(NativeMethodAccessorImpl.java:62) ~[?:1.8.0_101]
at sun.reflect.DelegatingMethodAccessorImpl.invoke(DelegatingMethodAccessorImpl.java:43) ~[?:1.8.0_101]
at java.lang.reflect.Method.invoke(Method.java:498) ~[?:1.8.0_101]

Arpan Khagram
Aug 12, 2017, 11:20:37 AM8/12/17
to Druid User
Hi Shamshed, Something looks to be wrong with the configuration. Can you send your jvm and runtime configuration of your historical nodes.
Regards,
Arpan Khagram

Gian Merlino
Aug 14, 2017, 2:19:09 PM8/14/17
to druid...@googlegroups.com
Hey Shamshad,
Please make sure that you have enough heap space allocated to the historical node. If you have a lot of data then you will probably need more than the default.
Gian
--
You received this message because you are subscribed to the Google Groups "Druid User" group.
To unsubscribe from this group and stop receiving emails from it, send an email to druid-user+unsubscribe@googlegroups.com.
To post to this group, send email to druid...@googlegroups.com.
To view this discussion on the web visit https://groups.google.com/d/msgid/druid-user/65f31d43-0e19-4c4e-8128-23137aa79e2c%40googlegroups.com.
For more options, visit https://groups.google.com/d/optout.
Shamshad Ahmed Khan
Aug 15, 2017, 4:35:07 AM8/15/17
to Druid User
Thanks Gian, Its the problem of heap. When I increased heap it works. But to what limit should I be able to increase heap if my data gets bigger in future
Gian
To unsubscribe from this group and stop receiving emails from it, send an email to druid-user+...@googlegroups.com.
Gian Merlino
Aug 15, 2017, 1:33:52 PM8/15/17
to druid...@googlegroups.com
I find that for historical nodes, usually .5g to 1g per processor works well.
Gian
To unsubscribe from this group and stop receiving emails from it, send an email to druid-user+unsubscribe@googlegroups.com.
To post to this group, send email to druid...@googlegroups.com.
To view this discussion on the web visit https://groups.google.com/d/msgid/druid-user/aabea6fb-fa35-4606-b9ad-275b767a763d%40googlegroups.com.
Arpan Khagram
Sep 26, 2017, 3:19:08 AM9/26/17
to Druid User
Hi @Gianm, I had 2 questions with respect to Historical configurations as below ----
What exactly does it use heap for when we have already allocated buffer size per processing thread (druid.processing.numThreads and druid.processing.buffer.sizeBytes) ?
Also wanted to ask we always have to maintain druid.processing.numThreads+druid.processing.numMergeBuffers+1 = number of cores For Historical Node or we can have more number of threads than cores ? Does each thread runs on separate core for historical node ? I understand the scenario in case of middleManager where it creates JVM against each task and each task will run on separate core/JVM.
Regards,
Arpan Khagram
Arpan Khagram
Gian
Arpan Khagram
Sep 29, 2017, 4:34:05 AM9/29/17
to Druid User
Hi @Gianm, For one of the set up we have, we have around 3.31 GB of total data on Historical and heap size it is using is almost reaching ~7 GB. Any idea what else it is loading in memory ? I tried disabling cache as well but that did not make any difference. Any help to understand this behavior appreciated. Thanks in advance.
Attaching snapshots.
Regards,
Arpan Khagram
Arpan Khagram
Oct 24, 2017, 9:56:31 AM10/24/17
to Druid User
Hi Everyone - I am still having same issue, although size of my historical node at this moment is around 9 GB - Historical heap usage have reached to around 19 GB. :(
Can someone please suggest what could be going wrong here ?
Regards,
Arpan Khagram

David Lim
Nov 1, 2017, 12:17:04 PM11/1/17
to Druid User
Hey Arpan,
The historical nodes use the JVM heap for things like query caching, query time lookups, and buffering partial results from processing threads that haven't been merged yet. You'll see the most heap usage for select and topN queries that have large thresholds.
What is your max heap size (Xmx) set to? When you say your heap usage has reached 19GB, is this 19GB of retained objects or is some of it stuff awaiting garbage collection?
David Lim
Nov 1, 2017, 12:23:31 PM11/1/17
to Druid User
I just read your related post here: https://groups.google.com/d/msg/druid-user/W7UrredvTy8/0KUFHTJFCAAJ, so you can ignore my last two questions.
Like Gian suggested, I would generate a heap dump and inspect it to see where the memory is being used, but the items that I mentioned are the usual culprits from core Druid (+ memory usage from any extensions that you might have loaded).
Like Gian suggested, I would generate a heap dump and inspect it to see where the memory is being used, but the items that I mentioned are the usual culprits from core Druid (+ memory usage from any extensions that you might have loaded).
Arpan Khagram
Nov 2, 2017, 3:20:30 PM11/2/17
to Druid User
Hi David Thanks for replying. It could not be related to query because when I restart historical node (and there are not queries from broker) i can see it using this much ( when I look at it with JVisualVM as soon it has loaded all the segments).
I will review my extensions as well but there is nothing unusual there - I shall re-check.
Anything else you suggest to check ? Heap memory is increasing day by day with data. Currently historical has 10.2G of data as seen from console and historical is eating up 18G. If we start with less memory say 15G it does not start and becomes unresponsive with long GC pause so it means it actually has eaten this much memory and nothing is garbage there.
Regards,
Arpan Khagram
Gian Merlino
Nov 2, 2017, 3:23:50 PM11/2/17
to druid...@googlegroups.com
Please do the heap dump and analyze that to see what class of objects are taking up most of the memory. Armed with that information someone on the list should be able to help you further.
Gian
--
You received this message because you are subscribed to the Google Groups "Druid User" group.
To unsubscribe from this group and stop receiving emails from it, send an email to druid-user+unsubscribe@googlegroups.com.
To post to this group, send email to druid...@googlegroups.com.
To view this discussion on the web visit https://groups.google.com/d/msgid/druid-user/68ea1545-92a9-4a5f-9add-8621b66749d4%40googlegroups.com.
Arpan Khagram
Nov 5, 2017, 1:47:50 AM11/5/17
to Druid User
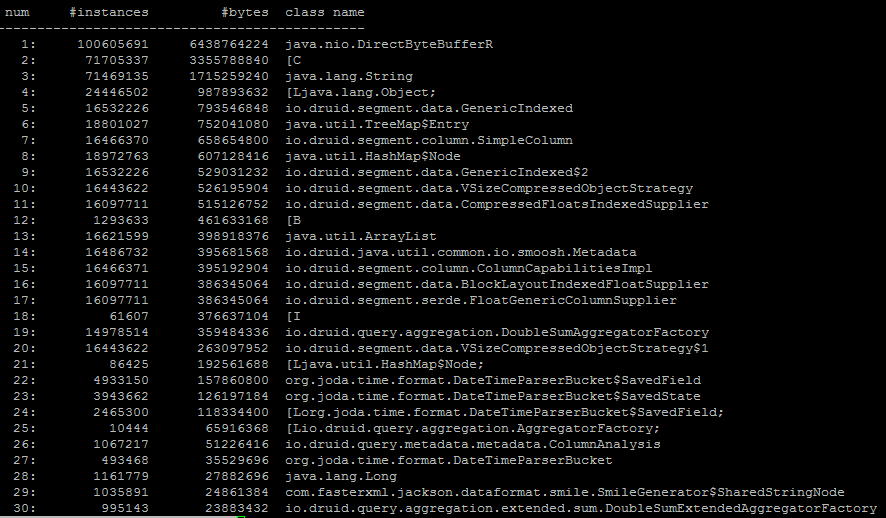
Hi Gian,David - I have taken histogram of the historical process ID, hope that helps to identify the cause. Attaching the same - together with that providing snapshot of historical node.
Memory snapshot (histogram is there in attachment)
[svuser@aps003a009 imply-2.3.3]$ jmap -heap 10242
Attaching to process ID 10242, please wait...
Debugger attached successfully.
Server compiler detected.
JVM version is 25.91-b14
using parallel threads in the new generation.
using thread-local object allocation.
Concurrent Mark-Sweep GC
Heap Configuration:
MinHeapFreeRatio = 40
MaxHeapFreeRatio = 70
MaxHeapSize = 26843545600 (25600.0MB)
NewSize = 5368709120 (5120.0MB)
MaxNewSize = 5368709120 (5120.0MB)
OldSize = 21474836480 (20480.0MB)
NewRatio = 2
SurvivorRatio = 8
MetaspaceSize = 21807104 (20.796875MB)
CompressedClassSpaceSize = 1073741824 (1024.0MB)
MaxMetaspaceSize = 17592186044415 MB
G1HeapRegionSize = 0 (0.0MB)
Heap Usage:
New Generation (Eden + 1 Survivor Space):
capacity = 4831838208 (4608.0MB)
used = 3085178392 (2942.2553939819336MB)
free = 1746659816 (1665.7446060180664MB)
63.85102851523293% used
Eden Space:
capacity = 4294967296 (4096.0MB)
used = 2706000800 (2580.6434631347656MB)
free = 1588966496 (1515.3565368652344MB)
63.003990799188614% used
From Space:
capacity = 536870912 (512.0MB)
used = 379177592 (361.61193084716797MB)
free = 157693320 (150.38806915283203MB)
70.6273302435875% used
To Space:
capacity = 536870912 (512.0MB)
used = 0 (0.0MB)
free = 536870912 (512.0MB)
0.0% used
concurrent mark-sweep generation:
capacity = 21474836480 (20480.0MB)
used = 18895758808 (18020.399864196777MB)
free = 2579077672 (2459.6001358032227MB)
87.99023371189833% used
17469 interned Strings occupying 1630264 bytes.
Regards,
Arpan Khagram
On Friday, November 3, 2017 at 12:53:50 AM UTC+5:30, Gian Merlino wrote:
Please do the heap dump and analyze that to see what class of objects are taking up most of the memory. Armed with that information someone on the list should be able to help you further.
Gian
On Thu, Nov 2, 2017 at 1:20 PM, Arpan Khagram <arpan.kh...@gmail.com> wrote:
Hi David Thanks for replying. It could not be related to query because when I restart historical node (and there are not queries from broker) i can see it using this much ( when I look at it with JVisualVM as soon it has loaded all the segments).
I will review my extensions as well but there is nothing unusual there - I shall re-check.
Anything else you suggest to check ? Heap memory is increasing day by day with data. Currently historical has 10.2G of data as seen from console and historical is eating up 18G. If we start with less memory say 15G it does not start and becomes unresponsive with long GC pause so it means it actually has eaten this much memory and nothing is garbage there.
Regards,
Arpan Khagram
--
You received this message because you are subscribed to the Google Groups "Druid User" group.
To unsubscribe from this group and stop receiving emails from it, send an email to druid-user+...@googlegroups.com.
Arpan Khagram
Nov 9, 2017, 12:21:09 AM11/9/17
to Druid User
Hi Gian/David - Would you please be able to check this once. Thanks.
David Lim
Nov 13, 2017, 3:34:05 PM11/13/17
to Druid User
Hi Arpan,
You mentioned that your historical has around ~10GB of data and it looks like you only have one historical node.
How many segments do you have across all of your datasources?
What is the typical size of a segment?
How many dimensions are you indexing for these datasources?
This information can all be found from the coordinator console.
If you have a large amount of very small segments with lots of dimensions, that could be a cause of the excessive memory usage you're seeing. Let us know what these numbers are and we can go from there.
Arpan Khagram
Nov 15, 2017, 5:09:02 AM11/15/17
to Druid User
Hi David,
Yes we are running on single Historical node as of now (It's test environment).
1. As of now we are having 13014 number of segments
2. Total size of historical node is 11-12GB and heap size it is consuming is close to 22GB.
3. Around 25 datasources
4. 7-8 KAFKA indexing tasks to get RAW data
5. Yes we are not doing any segment merging activity and most of the segments are in the range of 2-3 MBs.
6. Number of dimensions for each of the data source is not that much (around 3-10 for each) but we are having very high number of metrics for most of them. Few reaching up to 1500-3500 metrics.
Regards,
Arpan Khagram
David Lim
Nov 15, 2017, 6:27:32 PM11/15/17
to Druid User
Hey Arpan,
Druid historical nodes memory map the segments they serve, and they use ByteBuffer wrappers to reference the indexed columns in each segment. Your heap dump is showing ~100 million instances of these ByteBuffer wrappers which is consuming a significant portion of your heap, and this correlates with the large number of segments you have (relative to the amount of data you have) and the high number of metrics you are indexing.
The main thing you can do to alleviate this memory pressure is to look into segment compaction. 2-3 MB per segment is quite low; ideally you should be aiming at ~500MB per segment. This page: http://druid.io/docs/latest/ingestion/update-existing-data.html has some suggestions on how to do segment compaction using either Hadoop ingestion or standalone index tasks.
Also, maybe consider the kind of queries that you typically run against your data to determine if you're indexing data that is not actually ever used. It may be that you don't actually need to index 3k metrics, and dropping these unnecessary metrics will result in less overall memory usage.
Reply all
Reply to author
Forward
0 new messages