Adding mouseover actions on multi-line series charts
2,601 views
Skip to first unread message

Joseph Yaworski
Dec 21, 2012, 1:23:27 PM12/21/12
to d3...@googlegroups.com
Hello all:
I'm posting here as I am new to D3.JS, (and and javascript in general) and it seems to be acceptable to post here concerning issues (even though the group description says otherwise). If this really should be on StackOverflow, I'll post it there instead. However, it seems much more people follow the discussion here.
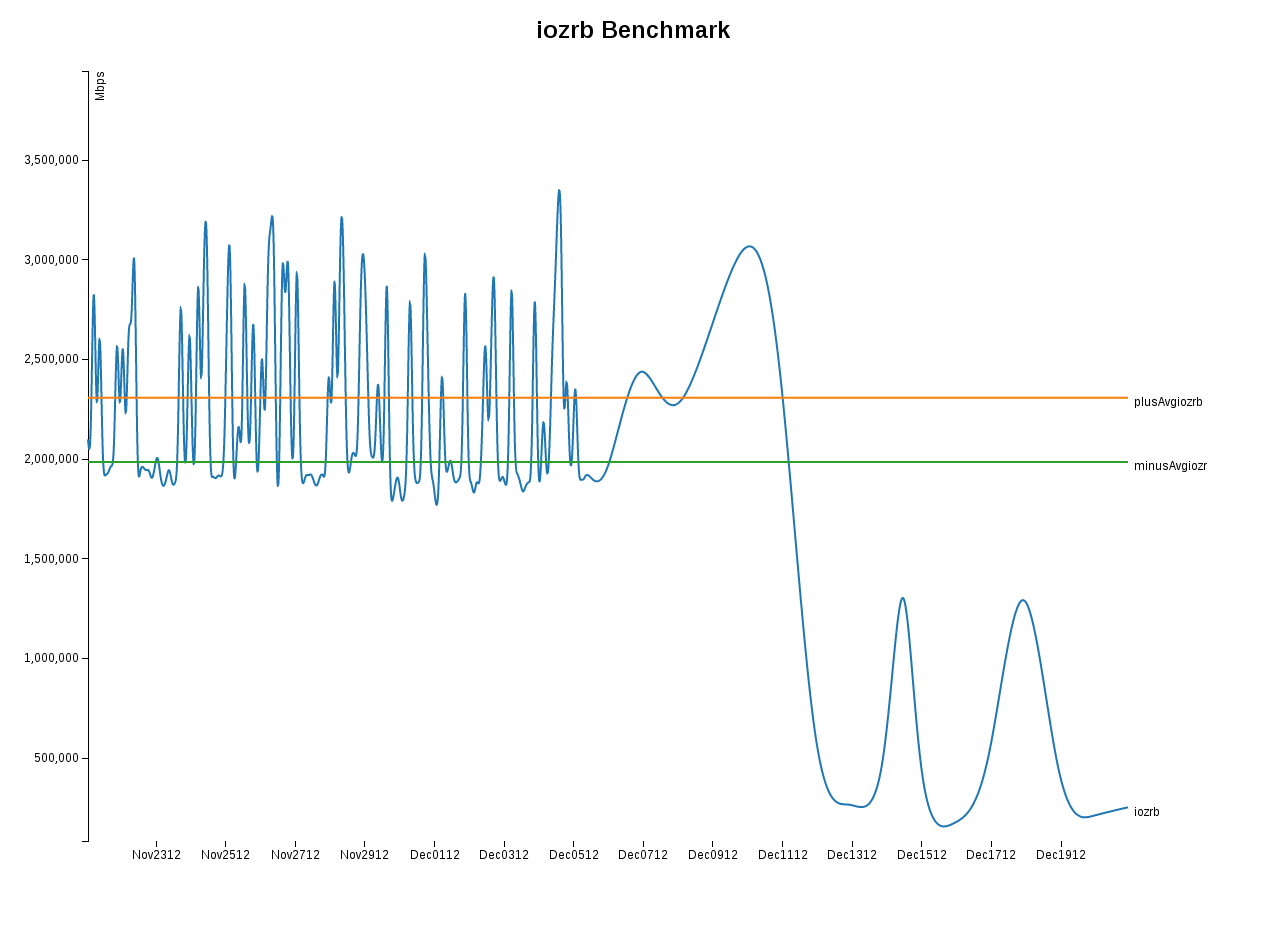
I have the multi series line chart code with slight modifications to support my data set. This is what I wish to do, and no solution I have looked at seems to function properly for me. I wish to overlay some element (circle, rectange, hidden, whichever) over each point on the line such that I could then attach a mouseover element on that point to display a box with data containing the d.time, d.jobID and how much that differs from an average. If possible, I would like the solution to only do this to the main line (the varying line) rather than the two lines drawn to represent the average. Here, I have a picture of the graph as-is for visual inspection. If that doesn't work, I have also attached it.
I have posted the code below.
<script>
....
d3.tsv("values.tsv", function(error, data) {
color.domain(d3.keys(data[0]).filter(function(key) { return key !== "time" && key !== "jobID"; }));
data.forEach(function(d) {
d.time = parseDate(d.time);
d.jobID = parseInt(d.jobID);
});
var points = color.domain().map(function(name) {
return {
name: name,
values: data.map(function(d) {
return {time: d.time, jobID: d.jobID, value: parseFloat(d[name],10)};
})
};
});
....
svg.append("g")
.attr("class", "x axis")
.attr("transform", "translate(0," + height + ")")
.call(xAxis);
svg.append("g")
.attr("class", "y axis")
.call(yAxis)
.append("text")
.attr("transform", "rotate(-90)")
.attr("y", 7)
.attr("dy", ".71em")
.style("text-anchor", "end")
.text("mbps");
var point = svg.selectAll(".point")
.data(points)
.enter().append("g")
.attr("class", "point");
point.append("path")
.attr("class", "line")
.attr("d", function(d) { return line(d.values); })
.style("stroke", function(d) { return color(d.name); });
point.append("text")
.datum(function(d) { return {name: d.name, jobID: d.jobID, value: d.values[d.values.length - 1]}; })
.attr("transform", function(d) { return "translate(" + x(d.value.time) + "," + y(d.value.value) + ")"; })
.attr("x", 6)
.attr("dy", ".7em")
.text(function(d) { return d.name; });
});
</script>
Thank you all for your help in advance. D3.JS seems like a pretty awesome piece of work, and I'm fortunate to have it.
I'm posting here as I am new to D3.JS, (and and javascript in general) and it seems to be acceptable to post here concerning issues (even though the group description says otherwise). If this really should be on StackOverflow, I'll post it there instead. However, it seems much more people follow the discussion here.
I have the multi series line chart code with slight modifications to support my data set. This is what I wish to do, and no solution I have looked at seems to function properly for me. I wish to overlay some element (circle, rectange, hidden, whichever) over each point on the line such that I could then attach a mouseover element on that point to display a box with data containing the d.time, d.jobID and how much that differs from an average. If possible, I would like the solution to only do this to the main line (the varying line) rather than the two lines drawn to represent the average. Here, I have a picture of the graph as-is for visual inspection. If that doesn't work, I have also attached it.
I have posted the code below.
<script>
....
d3.tsv("values.tsv", function(error, data) {
color.domain(d3.keys(data[0]).filter(function(key) { return key !== "time" && key !== "jobID"; }));
data.forEach(function(d) {
d.time = parseDate(d.time);
d.jobID = parseInt(d.jobID);
});
var points = color.domain().map(function(name) {
return {
name: name,
values: data.map(function(d) {
return {time: d.time, jobID: d.jobID, value: parseFloat(d[name],10)};
})
};
});
....
svg.append("g")
.attr("class", "x axis")
.attr("transform", "translate(0," + height + ")")
.call(xAxis);
svg.append("g")
.attr("class", "y axis")
.call(yAxis)
.append("text")
.attr("transform", "rotate(-90)")
.attr("y", 7)
.attr("dy", ".71em")
.style("text-anchor", "end")
.text("mbps");
var point = svg.selectAll(".point")
.data(points)
.enter().append("g")
.attr("class", "point");
point.append("path")
.attr("class", "line")
.attr("d", function(d) { return line(d.values); })
.style("stroke", function(d) { return color(d.name); });
point.append("text")
.datum(function(d) { return {name: d.name, jobID: d.jobID, value: d.values[d.values.length - 1]}; })
.attr("transform", function(d) { return "translate(" + x(d.value.time) + "," + y(d.value.value) + ")"; })
.attr("x", 6)
.attr("dy", ".7em")
.text(function(d) { return d.name; });
});
</script>
Thank you all for your help in advance. D3.JS seems like a pretty awesome piece of work, and I'm fortunate to have it.
Joseph Yaworski
Dec 26, 2012, 12:43:47 PM12/26/12
to d3...@googlegroups.com
Since there hasn't been a response, I've posted the question on stackoverflow. Thanks everyone!
http://stackoverflow.com/questions/14043455/overlay-circle-text-etc-over-d3-js-multi-series-lines
http://stackoverflow.com/questions/14043455/overlay-circle-text-etc-over-d3-js-multi-series-lines

Makoto Inoue
Dec 26, 2012, 12:48:37 PM12/26/12
to d3...@googlegroups.com
Hi,
Can you add your code into code sharing site such as bl.ocks.org, tributary.io, or jsfiddle.net so that it's easier to fiddle and tweak ? It's also important that you provide the data (values.tsv) as well.
Thanks.
Makoto
Joseph Yaworski
Dec 26, 2012, 1:44:45 PM12/26/12
to d3...@googlegroups.com, inou...@googlemail.com
Thanks for the response. I'll note that I've never used these tools, so my formatting is likely off. Here's the link.
http://jsfiddle.net/F6WYP/1/
http://jsfiddle.net/F6WYP/1/
Makoto Inoue
Dec 26, 2012, 1:53:32 PM12/26/12
to Joseph Yaworski, d3...@googlegroups.com
Hi,
Looks like it's raising some syntax error. Check error messages from web inspector console (right click -> inspect element).
Thanks.
Makoto
Joseph Yaworski
Dec 26, 2012, 5:25:26 PM12/26/12
to Makoto Inoue, d3...@googlegroups.com
I missed the list on this.
On Wed, Dec 26, 2012 at 5:24 PM, Joseph Yaworski <guard...@gmail.com> wrote:
Makoto:This worked fantastically, with a few modifications of course. It appears D3 is very much into making different variables to perform different functions; as a non-JS person, I don't see why it's not possible to use multiple actions per variable, but this works quite nicely.Thanks a lot. I'll credit you in StackOverflow. Answer there, if you want.
Re 1:I noticed another SO question that stated the basis interpolation wouldn't work in this fashion, and he had to use cardinal. I'm not sure what that details exactly, so I just left the interpolate statement off. It works well that way.
Re 2:I can pre-calculate the value and then display it in a variable, or in the TSV file directly and display it like I do with the jobID. If there's a nicer way to do that though, I'd be open to experimentation.
On Wed, Dec 26, 2012 at 3:42 PM, Makoto Inoue <inou...@googlemail.com> wrote:Hi, Joseph.Is it a bit like this?http://jsfiddle.net/makoto/5VwRB/
There are still 2 unsolved issues though (love to hear advice from more experienced d3 people).1. I don't know how to fit circles into smooth path, so removed ".interpolate("basis")"2. I don't know how to calculate diff of plusAvgpisec and pisec on the fly while plotting the chart. Maybe you can pre calculate after passing data to d3?About mouseover/mouseout event, I did a hacky way to append text on the fly and removed any sibling texts which may cause extra bugs in future. You may want to attach text while first rendering, but set opacity to 0, then change opacity when you mouseover/out.Hope this helps.MakotoOn Wed, Dec 26, 2012 at 7:22 PM, Joseph Yaworski <guard...@gmail.com> wrote:
Thanks! I fixed it. I had to modify the string.
Reply all
Reply to author
Forward
0 new messages