CCCV Syllable Structure and ṃ

Mārcis Gasūns
fricative homorganic (i.e. sharing the same place of articulation) to the following consonant.
Reading and asking if something has been published in this field for Sanskrit?
I'm aware only of Elizarenkova 2004.

Nityanand Misra
On Saturday, December 21, 2013 3:02:56 AM UTC+8, Mārcis Gasūns wrote:
Namaste,Is CCCV actually a rare syllable in Sanskrit? I do not think so.
No it is not rare. Of the 7.5 million syllables in Digital Corpus of Sanskrit (DCS), the pattern CCCV occurs in more than 115,000 syllables (around 1.5% of the total syllables).
You can check this and all other combinations of your interest with the R code below.
# Read file
data <- read.delim( 'http://kjc-fs-cluster.kjc.uni-heidelberg.de/dcs/data/syllables/syllables.dat', sep=";", header=TRUE, comment.char="#", stringsAsFactors=FALSE);
# Delete Avagrahas
data$Syllable <- gsub( "'", "", data$Syllable );
# There are some rows with bad syllable data (< 0.02%) - retain only rows with clean data
data <- data[ !grepl( '[^athAHsnevidmyMkuroSpzUjIbgcNDlTRGJL]', data$Syllable ),];
# Map to consonants and vowels
data$Syllable2 <- data$Syllable;
data$Syllable2 <- gsub( "[kgcjTDpbtd]h", "C", data$Syllable2 );
data$Syllable2 <- gsub( "[kgcjTDpbBtdDGhJlmnNrsSvVyz]", "C", data$Syllable2 );
data$Syllable2 <- gsub( "[aA][iIuU]", "V", data$Syllable2 );
data$Syllable2 <- gsub( "[aAiIuURLeo]", "V", data$Syllable2 );
# Count of triple conjuncts
sum( data[grep( "[C]{3}", data$Syllable2 ),]$total )
[1] 116457
# Count of total syllables
sum( data$total )
[1] 7566142
# % of syllables with triple conjuncts
sum( data[grep( "[C]{3}", data$Syllable2 ),]$total ) / sum( data$total )
[1] 0.01539186
Mārcis Gasūns
- ta 3982 78961 45040 31293 18766 178042
- va 4983 76569 44747 30717 16986 174002
- sa 3893 75864 38874 25986 15449 160066
- ma 3412 70903 40963 23539 16112 154929
- ra 2534 54458 32641 28499 15644 133776
- na 3283 59642 34267 22763 13264 133219
- pa 4682 55596 33961 21098 12969 128306
- ya 4803 47977 30017 17312 10398 110507
- ca 2478 49648 27457 17279 11899 108761
- a 5174 57752 21378 13821 7089 105214
- [1] 337122
- [1] 7566142
- [1] 0.04455666
- CCCV
- VCCC
- CVCC
- CCVC
- STvI 1 0 0 0 0 1
- tvyA 1 0 0 0 0 1
- Aj 1 0 0 0 0 1
- suk 1 0 0 0 0 1
- nuT 1 0 0 0 0 1
- sji 1 0 0 0 0 1
- lgha 1 0 0 0 0 1
- JoH 1 0 0 0 0 1
- Ac 1 0 0 0 0 1
- pzya 1 0 0 0 0 1
- aut 1 0 0 0 0 1
- thyR 1 0 0 0 0 1
- 'suG 1 0 0 0 0 1
- Nit 1 0 0 0 0 1
- Nal 1 0 0 0 0 1
- jvat 1 0 0 0 0 1
- GkIM 0 1 0 0 0 1
- lpsya 0 1 0 0 0 1
- mvo 0 1 0 0 0 1
- 'nnAd 1 0 0 0 0 1
- 'dbhyo 1 0 0 0 0 1
- ti 0 2 0 0 0 2
- ma 0 0 1 0 0 1
- [1] 0.9638667
Nityanand Misra
Namaste,Oliver's data amazing as usual. How did you find it? Seems like from https://groups.google.com/d/msg/samskrita/4oGLpUXyjxI/MV4z0uIoTQcJ
Is the "five-sample Chi-square test" code available for download, Nityanand, the prop.test() one? http://ideone.com/XKVHTM seems to be your testing of it lately.
Do you have a background in math or statistics? If you do not, I will add some comments and references also.
And I found "I would start with a prose work like Daśakumāracaritam rather than a poetic work. The reason is that the constraints of prosody may bias the frequency of long and short syllables and in some cases also the consonants. For example if you choose a work like Meghadūta or Bhṛṅgadūta which is entirely composed in the Mandākrāntā, you would get 10 long syllables for every 7 short syllables which may be undesirable." at https://groups.google.com/forum/#!msg/samskrita/4oGLpUXyjxI/_xHkmfCfhn4JSo data for prose and metrical texts separately would maybe change the picture even more, who knows.
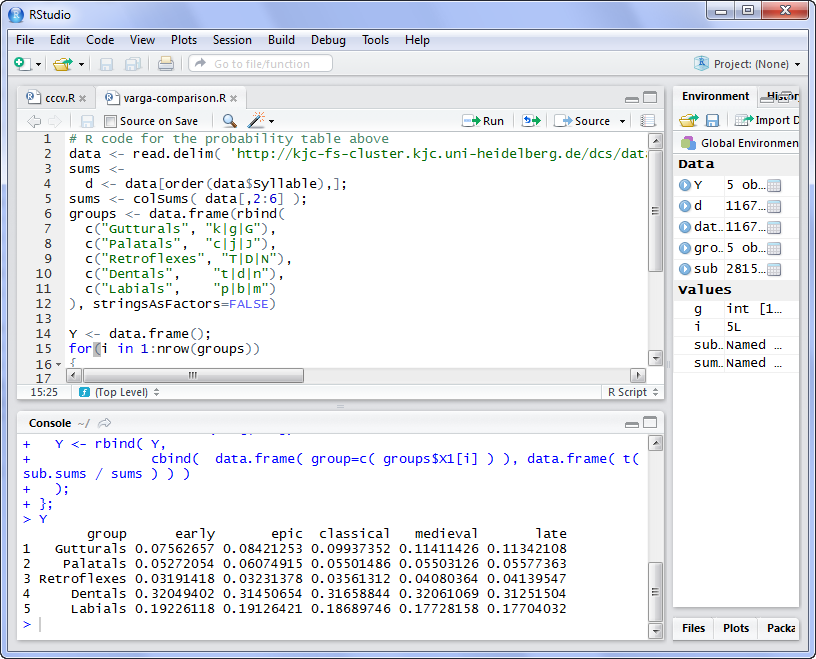
Thanks for the code, I made a video how I got different results running the same code http://youtu.be/1IVc7y7ICtc:
- [1] 337122
- [1] 7566142
- [1] 0.04455666
After taking that video I learned to select the whole code and press the "Run" button. Now I get exactly the same results. Documenting links http://samskrtam.ru/sanskrit-r-statistics/ here.But the question is not yet answered. It's closer than ever. To say CCCV I have to compare it with the other possible combinations.
- CCCV
- VCCC
- CVCC
- CCVC
sum( data[grep( "[C]{3}", data$Syllable2 ),]$total ) works for CCCV or VCCC as well? Right, works for both, should not. There must be a limitation set. I would want to keep CCCV and VCCC seperately and not mix them only because they have CCC (=[C]{3}) in common. "# Count of triple conjuncts" is not identical to CCCV in my case (it remains too vague).
# Match exactly "CCCV"
sum( data[grep( "^CCCV$", data$Syllable2 ),]$total )
[1] 96375
# Match various supersets of "CCCV"
sum( data[grep( "^CCCCV$", data$Syllable2 ),]$total )
[1] 1021
sum( data[grep( "^CCCVH$", data$Syllable2 ),]$total )
[1] 2907
sum( data[grep( "^CCCVC$", data$Syllable2 ),]$total )
[1] 5018
sum( data[grep( "^CCCVM$", data$Syllable2 ),]$total )
[1] 10866
sum( data[grep( "^CCCCVC$", data$Syllable2 ),]$total )
[1] 74
sum( data[grep( "^CCCCVM$", data$Syllable2 ),]$total )
[1] 101
sum( data[grep( "^CCCCVH$", data$Syllable2 ),]$total )
[1] 24
sum( data[grep( "^CCCCCV$", data$Syllable2 ),]$total )
[1] 71
96375 + 1021 + 2907 + 5018 + 10866 + 74 + 101 + 24 + 71
[1] 116457
sum( data[grep( "CCCV", data$Syllable2 ),]$total )
[1] 116457
Can we be sure Oliver did not mistakes in syllable splitting? I hope he did not. It seems some of them hint to errors in the OCR of texts. No?
# Read file
data <- read.delim( 'http://kjc-fs-cluster.kjc.uni-heidelberg.de/dcs/data/syllables/syllables.dat', sep=";", header=TRUE, comment.char="#", stringsAsFactors=FALSE);
sort( unique( unlist( strsplit( data$Syllable, NULL ) ) ) )
[1] "'" "-" " " " " "*" "," "." "/" ";" "?" "[" "]" "_" "{" "}" "~" "¡" "›" "¤" "<" ">" "»" "0" "1" "2" "²" "3" "4" "5" "6" "9" "a" "A" "â" "ã" "æ" "b" "c" "d" "D"
[41] "e" "g" "G" "h" "H" "i" "I" "í" "j" "J" "k" "l" "L" "m" "M" "n" "N" "o" "p" "r" "R" "s" "S" "t" "T" "u" "U" "v" "V" "y" "z" "Z"
nrow( data )
[1] 11670
sum( data$total )
[1] 7567475
# Delete Avagraha
data$Syllable <- gsub( "'", "", data$Syllable );
# There are some rows with bad syllable data (< 0.02%) - retain only rows with clean data
data <- data[ !grepl( '[^athAHsnevidmyMkuroSpzUjIbgcNDlTRGJL]', data$Syllable ),];
sort( unique( unlist( strsplit( data$Syllable, NULL ) ) ) )
[1] "a" "A" "b" "c" "d" "D" "e" "g" "G" "h" "H" "i" "I" "j" "J" "k" "l" "L" "m" "M" "n" "N" "o" "p" "r" "R" "s" "S" "t" "T" "u" "U" "v" "y" "z"
nrow( data )
[1] 11451
sum( data$total )
[1] 7566142
1 - 11451 / 11670
[1] 0.01876607
1 - 7566142 / 7567475
[1] 0.0001761486
Anyway I have no clue (I'm learning GREP for months now, but still bad at it is as regular expressions do not come always easy for me) how to code CVCC or CCVC. How to compare these 4 between each other. It is also said VCC is even rarer. So I have to compare with CVC & CCV.
"# There are some rows with bad syllable data (< 0.02%) - retain only rows with clean data" - does the 0.02% cutts of the single instance only or double ones as well? Have you looked at it? Because as you must have noticed it's nasty indeed:
Number of syllables with C
- [1] 0.9638667
So the rest 0.04 are syllables with V.
As per Elizarenkova a Sanskrit syllable can consist only out of 4 elements, CCCVCC at once is impossible.
sum( data[grep( "CCCVCC", data$Syllable2 ),]$total
[1] 0
So CCCVCCC at http://books.google.ru/books?id=jQw6AAAAQBAJ&pg=PA33&lpg=PA33&dq=CCCVCC+sanskrit&source=bl&ots=W7KamcV-Ij&sig=AHbIJQ5MeEdUXSQ1-2LM2jx_tq8&hl=en&sa=X&ei=loy0Ur6AG8PDyQPBtIGwAQ&redir_esc=y#v=onepage&q=CCCVCC%20sanskrit&f=false in the Sanskrit samples should be treated as wrong. Wrong?
Thanks,Marcis
Nityānanda Miśra
Vice President, Equity Markets, Citigroup, Hong Kong SAR
Member, Advisory Council, JRHU, Chitrakoot, Uttar Pradesh, India
http://nmisra.googlepages.com
Mārcis Gasūns
On Saturday, 21 December 2013 16:19:57 UTC+4, Nityanand Misra wrote:
Is the "five-sample Chi-square test" code available for download, Nityanand, the prop.test() one? http://ideone.com/XKVHTM seems to be your testing of it lately.I have lost it. I had it on my old machine. I can write it again, it is simple. But why do you need it? You would not find it useful unless you want to statistically test for stability of proportion of a certain set of syllables across different periods.
Do you have a background in math or statistics? If you do not, I will add some comments and references also.
And I found "I would start with a prose work like Daśakumāracaritam rather than a poetic work. The reason is that the constraints of prosody may bias the frequency of long and short syllables and in some cases also the consonants. For example if you choose a work like Meghadūta or Bhṛṅgadūta which is entirely composed in the Mandākrāntā, you would get 10 long syllables for every 7 short syllables which may be undesirable." at https://groups.google.com/forum/#!msg/samskrita/4oGLpUXyjxI/_xHkmfCfhn4JSo data for prose and metrical texts separately would maybe change the picture even more, who knows.Yes, because data for metrical texts would give you "conditional probabilities", conditional upon the text fitting the metre. Data for prose would not have this condition, so one may think of the results as "unconditional probabilities"
Thanks for the code, I made a video how I got different results running the same code http://youtu.be/1IVc7y7ICtc:
- [1] 337122
- [1] 7566142
- [1] 0.04455666
I don't know how you got that. I use the raw R GUI, not R Studio.
I saw the video, was interesting to see how you "figure things out" in something that is totally new, the language here. That I must say is a talent not many people have.
sum( data[grep( "[C]{3}", data$Syllable2 ),]$total ) works for CCCV or VCCC as well? Right, works for both, should not. There must be a limitation set. I would want to keep CCCV and VCCC seperately and not mix them only because they have CCC (=[C]{3}) in common. "# Count of triple conjuncts" is not identical to CCCV in my case (it remains too vague).There is no case of VCCC in Oliver's data.
Remember he has "single-voweled" syllables.
I think you are thinking about Yamuna Kachru's book which firstly talks about Hindi (which has Schwa syncope) and not Sanskrit and patterns of words and not single-vowelled syllables (एकाच्).
- Number of open syllables?
- Number of closed syllables?
Markup issues
[la
<p11>pra
''jJa
Encoding issues
j¤e
j¤i
S›A
¤jA
j¤aH
S›hi
rS›yA
j¤air
›a
›ha
жga
Bad input
9zlSma
2ka
3va
4zo
__a
*i
*va
*ya
*nA
*vi
*ni
*cA
*ra
*ka
d{}vR
- ~ci
"# There are some rows with bad syllable data (< 0.02%) - retain only rows with clean data" - does the 0.02% cuts of the single instance only or double ones as well? Have you looked at it? Because as you must have noticed it's nasty indeed:
No it only throws out characters outside the Harvard-Kyoto transliteration alphabet.
As per Elizarenkova a Sanskrit syllable can consist only out of 4 elements, CCCVCC at once is impossible.Yes, no occurrence of CCCVCC.
sum( data[grep( "CCCVCC", data$Syllable2 ),]$total
[1] 0
So CCCVCCC at http://books.google.ru/books?id=jQw6AAAAQBAJ&pg=PA33&lpg=PA33&dq=CCCVCC+sanskrit&source=bl&ots=W7KamcV-Ij&sig=AHbIJQ5MeEdUXSQ1-2LM2jx_tq8&hl=en&sa=X&ei=loy0Ur6AG8PDyQPBtIGwAQ&redir_esc=y#v=onepage&q=CCCVCC%20sanskrit&f=false in the Sanskrit samples should be treated as wrong. Wrong?As I said earlier, firstly the page in the book is about Hindi pronunciation. Hindi has Schwa syncope, Samskrita does not. The words स्पृष्ट is pronounced CCVCCV in Samskrita, but CCCVCC in Hindi.
Secondly this page talks about words and not single-syllabled vowels, which is Oliver's dataset.
Nityanand Misra
On Sunday, December 22, 2013 12:17:27 AM UTC+8, Mārcis Gasūns wrote:
On Saturday, 21 December 2013 16:19:57 UTC+4, Nityanand Misra wrote:Is the "five-sample Chi-square test" code available for download, Nityanand, the prop.test() one? http://ideone.com/XKVHTM seems to be your testing of it lately.I have lost it. I had it on my old machine. I can write it again, it is simple. But why do you need it? You would not find it useful unless you want to statistically test for stability of proportion of a certain set of syllables across different periods.I would want to see the difference of output.
See attached - it is a plaint text file with R code. No copyright or copyleft, use as you like and you are not obliged to credit me.
For theory on the test, you may refer the following references (from the help page here)
Wilson, E.B. (1927) Probable inference, the law of succession, and statistical inference. J. Am. Stat. Assoc., 22, 209–212.
Newcombe R.G. (1998) Two-Sided Confidence Intervals for the Single Proportion: Comparison of Seven Methods. Statistics in Medicine 17, 857–872.
Newcombe R.G. (1998) Interval Estimation for the Difference Between
Independent Proportions: Comparison of Eleven Methods.
Statistics in Medicine 17, 873–890.
Thanks, some great hints. What I wonder is
- Number of open syllables?
What do you mean by "open syllable"?
sum( data[grep( "^V$", data$Syllable2 ),]$total )[1] 255956
- Number of closed syllables?
sum( data[grep( "^C$", data$Syllable2 ),]$total )[1] 0Why 0?
Single consonant is not a syllable in Samskrita, and not a syllable in Hellwig's data.
Mārcis Gasūns
On Sunday, 22 December 2013 13:23:01 UTC+4, Nityanand Misra wrote:
I have lost it. I had it on my old machine. I can write it again, it is simple. But why do you need it? You would not find it useful unless you want to statistically test for stability of proportion of a certain set of syllables across different periods.I would want to see the difference of output.
See attached - it is a plaint text file with R code. No copyright or copyleft, use as you like and you are not obliged to credit me.
All periods Early & Epic Epic & Classical Classical & Medieval Medieval & Late
Gutturals 0.000000e+00 3.607401e-43 0.000000e+00 0.000000e+00 1.267108e-01
Palatals 1.175834e-246 8.720096e-51 1.598550e-161 9.514065e-01 2.303646e-02
Retroflexes 0.000000e+00 3.181280e-01 6.859133e-92 1.400428e-127 3.685050e-02
Dentals 3.114376e-48 1.022459e-08 6.671614e-07 2.707000e-14 3.677069e-34
Labials 0.000000e+00 2.611753e-01 4.399987e-35 1.750870e-106 6.592439e-01
For theory on the test, you may refer the following references (from the help page here)Wilson, E.B. (1927) Probable inference, the law of succession, and statistical inference. J. Am. Stat. Assoc., 22, 209–212.
Newcombe R.G. (1998) Two-Sided Confidence Intervals for the Single Proportion: Comparison of Seven Methods. Statistics in Medicine 17, 857–872.
Newcombe R.G. (1998) Interval Estimation for the Difference Between Independent Proportions: Comparison of Eleven Methods. Statistics in Medicine 17, 873–890.
What do you mean by "open syllable"?
What is meant by "closed syllable"?
Single consonant is not a syllable in Samskrita, and not a syllable in Hellwig's data.
Nityanand Misra
Answers inline.
Thanks, but the links and articles do not help. Please explain in plain English https://docs.google.com/document/d/1nDDLsylG6hp6v9Q-gSnQsiJz9sjg0wJbO8_amqAZQZ0/edit#All periods Early & Epic Epic & Classical Classical & Medieval Medieval & Late
Gutturals 0.000000e+00 3.607401e-43 0.000000e+00 0.000000e+00 1.267108e-01
Palatals 1.175834e-246 8.720096e-51 1.598550e-161 9.514065e-01 2.303646e-02
Retroflexes 0.000000e+00 3.181280e-01 6.859133e-92 1.400428e-127 3.685050e-02
Dentals 3.114376e-48 1.022459e-08 6.671614e-07 2.707000e-14 3.677069e-34
Labials 0.000000e+00 2.611753e-01 4.399987e-35 1.750870e-106 6.592439e-01
1) 0.000000e means that there is no change? +00 stands for no change? + can be only 00?
https://groups.google.com/forum/#!msg/samskrita/4oGLpUXyjxI/MV4z0uIoTQcJ
So 0e+00 means the p-value is infinitesimally small, which means there is enough evidence against the assumption of no change. Which means the conclusion is the ratio has changed.
2) 1.175834e and 9.514065e - 1 is the minimum, 10 - maximum?3) -01 small change? -92 mid change? -161 big change?4) e is for what?
5) how to build a plot with this data? Can we have something more aesthetic than just http://upload.wikimedia.org/wikipedia/commons/thumb/f/f6/Plots_from_lm_example.svg/540px-Plots_from_lm_example.svg.png ? Does http://latticeextra.r-forge.r-project.org/#marginal.plot&theme=default contains the kind of plot we could use to represent this kind of data?
It's FAR too specific :)A video series like http://www.youtube.com/watch?v=o0Y478jOjGk is what can help.Not those smart articles even a mathematician would read with toothache, really.
What do you mean by "open syllable"?The same as everybody else, http://www.allaboutlearningpress.com/how-to-teach-closed-and-open-syllables
Open SyllablesIn an open syllable, nothing comes after the vowel. Look at the word he. We say that the vowel is open. There is nothing closing it in.
Do you notice that in each of the open syllables, the vowel is long (says its name)?
What is meant by "closed syllable"?
Closed SyllablesIn a closed syllable, the vowel is followed by a consonant. Explain to your students that the vowel is “closed in” by the consonant. Take a look at these words:
# Closed syllables - end in a consonant
sum( data[grep( "C$", data$Syllable2 ),]$total )
[1] 406054
# Pure open syllables - end in a vowel
sum( data[grep( "V$", data$Syllable2 ),]$total )
[1] 6404405
# Semi-open syllables - end in a vowel + Anusvaara
sum( data[grep( "VM$", data$Syllable2 ),]$total )
[1] 461717
# Semi-open syllables - end in a vowel + Visarga
sum( data[grep( "VH$", data$Syllable2 ),]$total )
[1] 277554
# Do they add up?
406054 + 6404405 + 461717 + 277554
[1] 7549730
sum( data$total )
[1] 7566142
# Not quite! That's because there are some bad values still there
# Let's find them out
unique( data$Syllable2 )
[1] "V" "CV" "CVH" "CCV" "CVC" "CVM" "CCVC" "CCVH" NA "CCVM" "CCCV" "CCCCV" "CCCVH" "CCCVC" "CCCVM" "CCCCVC" "VM" "VC"
[19] "VH" "CCCCVM" "CVV" "CCCCVH" "MCV" "CCCCCV" "MCVH" "MCVC" "HCV" "CCMCV" "CCHVH" "CMV" "CCVV" "CCHV" "MCVM" "CMCV" "VV" "HCVH"
# Ah, see the "NA" there - some missing values
# Let's see the rows with these missing values
data[is.na(data$Syllable2),]
Syllable early epic classical medieval late total Syllable2
74 <NA> 661 6231 4873 2866 1781 16412 <NA>
# Hmm, is that 16412 the missing number from the total?
# Let's check
406054 + 6404405 + 461717 + 277554 + 16412
[1] 7566142
sum( data$total )
[1] 7566142
# Yes, perfect match, so let's throw the row out
data <- data[!is.na( data$Syllable2 ),]
sum( data$total )
[1] 7549730
# This is same as before
# Now do the percentages
# Percentage of closed syllables - end in a consonant
sum( data[grep( "C$", data$Syllable2 ),]$total ) / 7549730
[1] 0.05378391
# Percentage of pure open syllables - end in a vowel
sum( data[grep( "V$", data$Syllable2 ),]$total ) / 7549730
[1] 0.8482959
# Percentage of semi-open syllables - end in a vowel + Anusvaara
sum( data[grep( "VM$", data$Syllable2 ),]$total ) / 7549730
[1] 0.06115676
# Percentage of semi-open syllables - end in a vowel + Visarga
sum( data[grep( "VH$", data$Syllable2 ),]$total ) / 7549730
[1] 0.03676343
Mārcis Gasūns
On Monday, 23 December 2013 03:35:56 UTC+4, Nityanand Misra wrote:
You ask a lot of questions :)
Answers inline.
On Mon, Dec 23, 2013 at 2:13 AM, Mārcis Gasūns <gas...@gmail.com> wrote:
Thanks, but the links and articles do not help. Please explain in plain English https://docs.google.com/document/d/1nDDLsylG6hp6v9Q-gSnQsiJz9sjg0wJbO8_amqAZQZ0/edit#All periods Early & Epic Epic & Classical Classical & Medieval Medieval & Late
Gutturals 0.000000e+00 3.607401e-43 0.000000e+00 0.000000e+00 1.267108e-01
Palatals 1.175834e-246 8.720096e-51 1.598550e-161 9.514065e-01 2.303646e-02
Retroflexes 0.000000e+00 3.181280e-01 6.859133e-92 1.400428e-127 3.685050e-02
Dentals 3.114376e-48 1.022459e-08 6.671614e-07 2.707000e-14 3.677069e-34
Labials 0.000000e+00 2.611753e-01 4.399987e-35 1.750870e-106 6.592439e-01The above table as output by R uses scientific notation. So a number like 4.399987e-35 means 4.399987 x 10 raised to -35. Or 4.399987 divided by 1 followed by 35 zeros.
1) 0.000000e means that there is no change? +00 stands for no change? + can be only 00?These are p-values for the Chi-square test. The smaller the p-value, the more is the evidence against our assumption (Null Hypothesis: No Change). The assumption for the test is no change (null hypothesis assumption is like the assumption in law - innocent until proven guilty).
Usually whenever the p-value is smaller than a threshold like 0.05 (5% significance) or 0.01 (1% significance), we reject the null hypothesis (assumption). For a large sample set, one can use even a smaller threshold like 0.001 (0.1% significance).
Under the link below, you can see between which periods we do not have enough evidence for change (numbers in red, all greater than 0.001) -
https://groups.google.com/forum/#!msg/samskrita/4oGLpUXyjxI/MV4z0uIoTQcJ
So 0e+00 means the p-value is infinitesimally small, which means there is enough evidence against the assumption of no change. Which means the conclusion is the ratio has changed.
That's the best I can explain in plan English, to learn more, one needs to understand Statistical Hypothesis Testing.
2) 1.175834e and 9.514065e - 1 is the minimum, 10 - maximum?3) -01 small change? -92 mid change? -161 big change?4) e is for what?(2) to (3): No, this is scientific notation. (4) E stands for "x 10 raised to".5) how to build a plot with this data? Can we have something more aesthetic than just http://upload.wikimedia.org/wikipedia/commons/thumb/f/f6/Plots_from_lm_example.svg/540px-Plots_from_lm_example.svg.png ? Does http://latticeextra.r-forge.r-project.org/#marginal.plot&theme=default contains the kind of plot we could use to represent this kind of data?One can use a heatmap. See here. Further discussion, I am afraid, is beyond the scope of a mailgroup discussion.
I currently do not have time or motivation for making YouTube videos. Will do when I have the leisure.
Ah I see. Then you may want to use the below. I get 5.4% closed syllables, 84.8% open syllables, 6.1% syllables with Anusvaara and 3.6% syllables with Visarga.
Nityanand Misra
On Wednesday, December 25, 2013 2:02:33 AM UTC+8, Mārcis Gasūns wrote:
The above table as output by R uses scientific notation. So a number like 4.399987e-35 means 4.399987 x 10 raised to -35. Or 4.399987 divided by 1 followed by 35 zeros.Ah, oh, ok. Is there a way to make it easier to read? I mean how do I actually make the plot, what is the R code to make plots out of it?
These are p-values for the Chi-square test. The smaller the p-value, the more is the evidence against our assumption (Null Hypothesis: No Change). The assumption for the test is no change (null hypothesis assumption is like the assumption in law - innocent until proven guilty).null hypothesis assumption - ok, this I've understood. But can we change the starting point? Can we take the maximum value as 100% and everything else less, compared to it?
You can if you like, but I would not recommend. A scaled p-value is no good. A p-value is understood and used as is in Statistics.
Usually whenever the p-value is smaller than a threshold like 0.05 (5% significance) or 0.01 (1% significance), we reject the null hypothesis (assumption). For a large sample set, one can use even a smaller threshold like 0.001 (0.1% significance).In our case which cells are smaller as the large sample set treshold? Our's is large, is it not?
You can find out on your own. Try "nrow" function with "ddply" in R.
Under the link below, you can see between which periods we do not have enough evidence for change (numbers in red, all greater than 0.001) -
https://groups.google.com/forum/#!msg/samskrita/4oGLpUXyjxI/MV4z0uIoTQcJ
So 0e+00 means the p-value is infinitesimally small, which means there is enough evidence against the assumption of no change. Which means the conclusion is the ratio has changed.So no change, no interest for us, right?
Weight of evidence (or p-value) against the null hypothesis aids in reaching a conclusion. Whether conclusion A is more interesting than conclusion B is a completely subjective matter.
One can use a heatmap. See here. Further discussion, I am afraid, is beyond the scope of a mailgroup discussion.Sure, can you please copy the code here? Or we can move to https://groups.google.com/forum/#!forum/sanskrit-programmers ? Never seen you there actually.
I currently do not have the time for this. Will come back after some weeks when I am freer.
Ah I see. Then you may want to use the below. I get 5.4% closed syllables, 84.8% open syllables, 6.1% syllables with Anusvaara and 3.6% syllables with Visarga.Yes, perfect. Only issue 3.6 should be 3.7, otherwise the total sum of all numbers is not 100.
Yes, I truncated rather than rounding. But you get the sense.
Thanks for the code. Why is not possible to get numbers and % with same single line of code? Strange :)
Very much possible. R-tists can do anything in R! There are people who make high frequency electronic markets on stock exchanges running massive installations of R in parallel.
I had shown them separately for better understanding. Try the "c" function (concatenate in R). Or "ddply" with "nrow" and then add another column which divides by sum.
M.G.