Changing branch length of outgroup
1,914 views
Skip to first unread message

Ollie White
Feb 19, 2018, 10:48:01 AM2/19/18
to ggtree
Hello all,
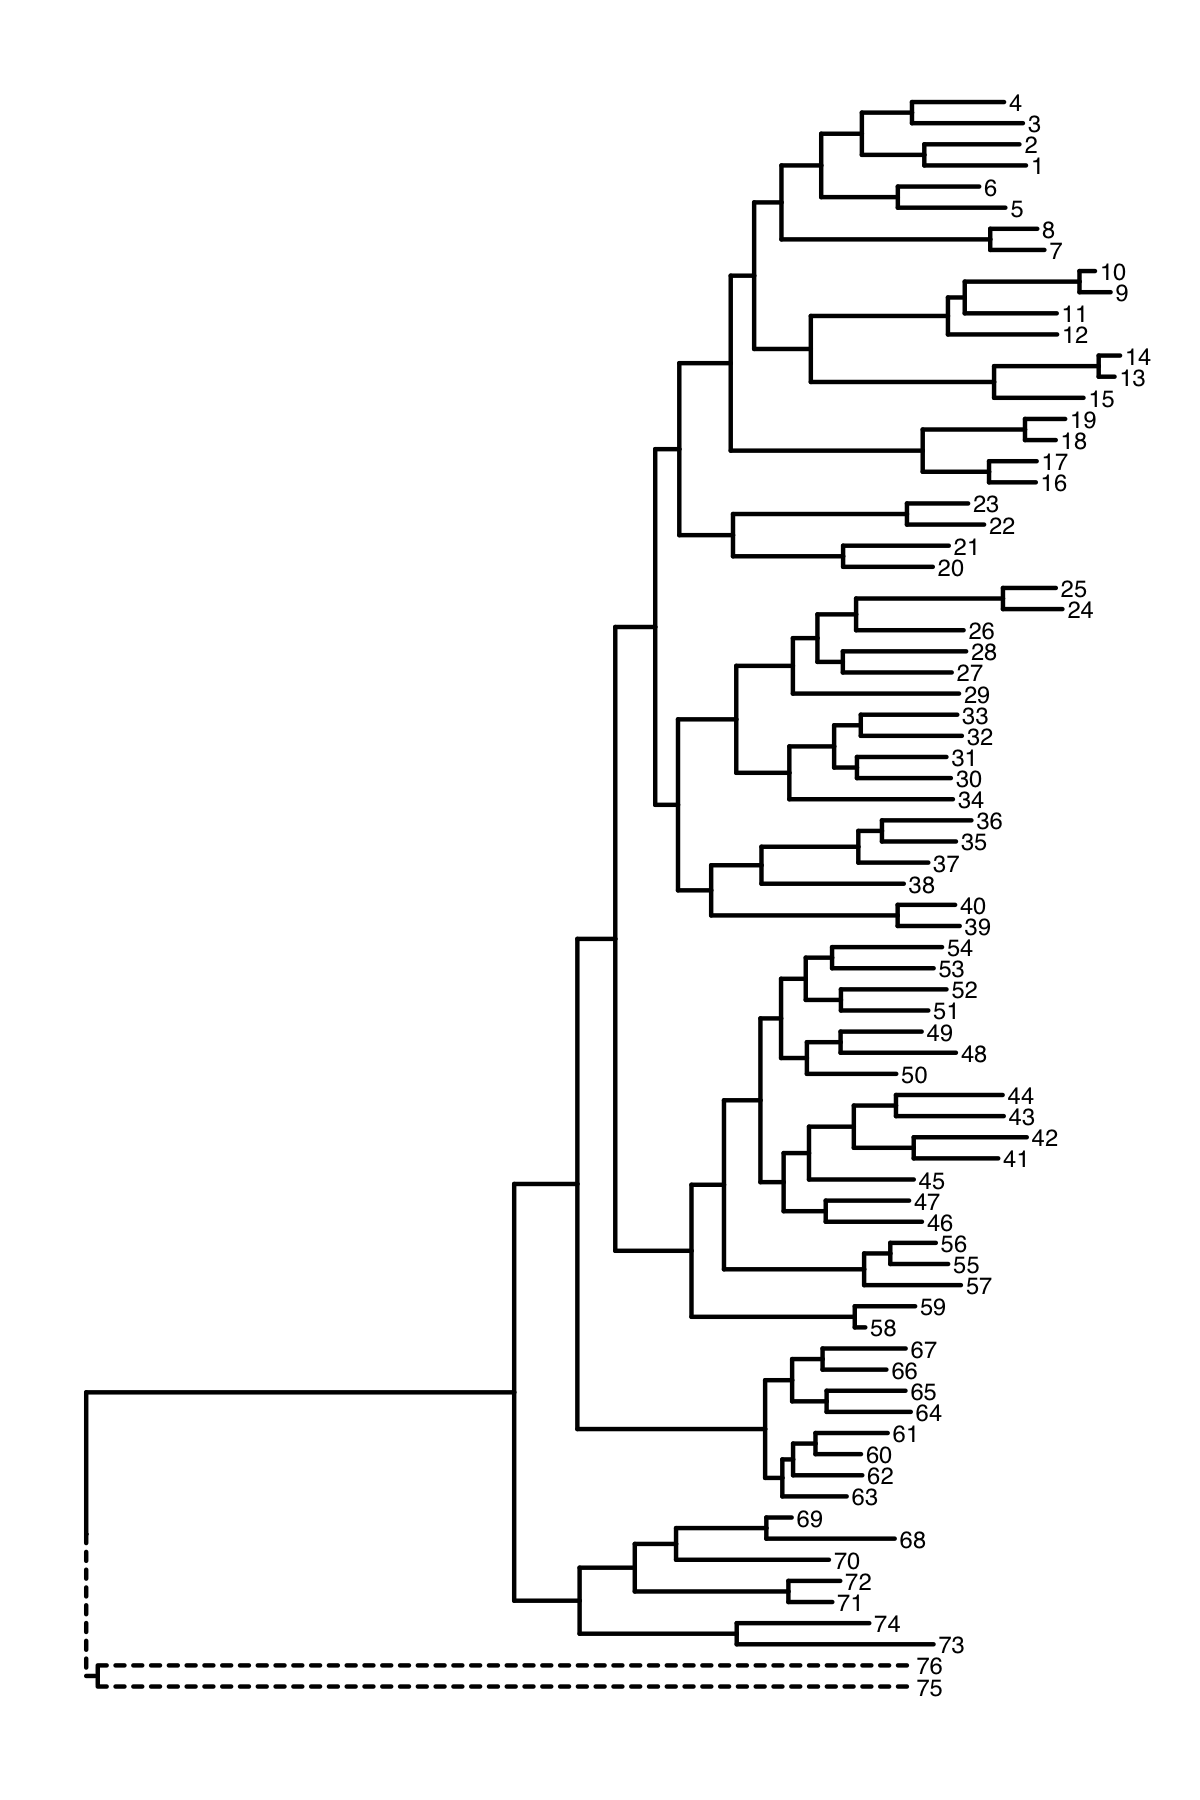
When I plot some data using ggtree, the out groups are on a very long branch length. The out groups are 75 and 76 in the example below.
I would like to keep the out groups in the tree but ignore their branch lengths to make presentation easier.

When I collapse the nodes 75 and 76 it does improve the appearance. but the out groups are still on a long branch.

Is it possible to produce a plot such as the one I created manually below where the branch lengths for the out groups is ignored

The script I have used so far is below and example data attached. Any thoughts would be much appreciated
Cheers
Ollie
library(ggtree)
# read in data
x <- read.tree("long-branch-example.newick")
# create ggtree object
tree <- ggtree(x) + geom_tiplab(size = 2)
# plot tree
tree
# find node for outgroup
MRCA(x, tip =c("75", "76"))
# collapse outgroup node
tree <- collapse(tree, node = 151)
# plot resulting tree
tree

Yu, Guangchuang
Feb 23, 2018, 5:28:59 AM2/23/18
to Ollie White, ggtree
You can use groupClade to group the 151 clade and use that info to set the linetype. For shortening 75 and 76, you can manipulate their x position.
library(ggtree)
x <- read.tree("long-branch-example.newick")
groupClade(x, 151) -> y
ggtree(y, aes(linetype=group)) + geom_tiplab(size = 2) -> p
p$data[tree$data$node %in% c(75, 76), "x"] = mean(p$data$x)
print(p)
To view this discussion on the web visit https://groups.google.com/d/msgid/bioc-ggtree/ec55f9af-afd2-400f-9b85-f66a8b4253a9%40googlegroups.com.--
G Yu, DK Smith, H Zhu, Y Guan, TTY Lam*. ggtree: an R package for visualization and annotation of phylogenetic trees with their covariates and other associated data, Methods in Ecology and Evolution, 2017, 8(1):28-36. doi:10.1111/2041-210X.12628
Homepage: https://guangchuangyu.github.io/ggtree
---
You received this message because you are subscribed to the Google Groups "ggtree" group.
To unsubscribe from this group and stop receiving emails from it, send an email to bioc-ggtree+unsubscribe@googlegroups.com.
To post to this group, send email to bioc-...@googlegroups.com.
--
--~--~---------~--~----~------------~-------~--~----~
Guangchuang Yu PhD
Postdoc researcher
State Key Laboratory of Emerging Infectious Diseases
School of Public Health
The University of Hong Kong
State Key Laboratory of Emerging Infectious Diseases
School of Public Health
The University of Hong Kong
Hong Kong SAR, China
-~----------~----~----~----~------~----~------~--~---
Yu, Guangchuang
Feb 24, 2018, 2:13:16 AM2/24/18
to Ollie White, ggtree
Sorry for typo. pls use the following code:
library(ggtree)
x <- read.tree("long-branch-example.newick")
groupClade(x, 151) -> y
ggtree(y, aes(linetype=group)) + geom_tiplab(size = 2
) -> p
p$data[p$data$node %in% c(75, 76), "x"] = mean(p$data$x)
print(p)
Reply all
Reply to author
Forward
0 new messages