what's the meaning of red/green/blue bars in dev-tools
3,630 views
Skip to first unread message

Liu Xin
Mar 19, 2012, 5:40:52 AM3/19/12
to android-d...@googlegroups.com, android-...@googlegroups.com
Hi,
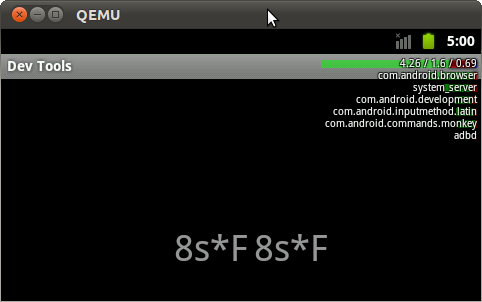
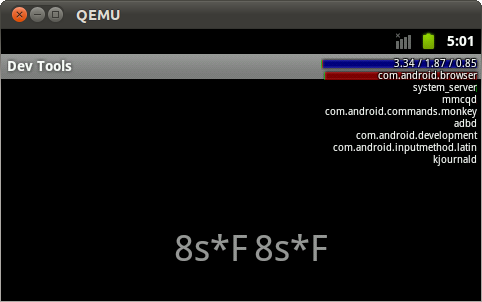
I turned on "show running processes" switch in "Development Settings", then the list of active processes appeared on the top-right screen.
I am curious what do those "red/green/blue" bars represent for ? evidently, green shows the CPU time spent in compositing the screen just like what the official page mentioned . it's because green bar will show up and obviously longer when i pan the screen in repeat.
further, can you explain the meaning for the top 3 numbers? see the snapshots:
thanks,
--lx

Dianne Hackborn
Mar 19, 2012, 9:09:35 PM3/19/12
to android-...@googlegroups.com
Green is time in userspace, red is time in the kernel, blue is io interrupt time. This option shows per-process CPU usage with overall CPU usage the top. It does not show time in surface flinger directly.
--
Dianne Hackborn
Android framework engineer
hac...@android.com
Note: please don't send private questions to me, as I don't have time to provide private support, and so won't reply to such e-mails. All such questions should be posted on public forums, where I and others can see and answer them.
--
You received this message because you are subscribed to the Google Groups "android-platform" group.
To post to this group, send email to android-...@googlegroups.com.
To unsubscribe from this group, send email to android-platfo...@googlegroups.com.
For more options, visit this group at http://groups.google.com/group/android-platform?hl=en.
Dianne Hackborn
Android framework engineer
hac...@android.com
Note: please don't send private questions to me, as I don't have time to provide private support, and so won't reply to such e-mails. All such questions should be posted on public forums, where I and others can see and answer them.
Reply all
Reply to author
Forward
0 new messages