Skip to first unread message

Molly
Feb 25, 2019, 3:21:18 PM2/25/19
to wrf-hyd...@ucar.edu
I am posting this on behalf of Sunni Siqueira Schoenauer (Sunni.Siqueira.ctr@nrlssc.navy.mil) and also as it may spark some discussion.
create plots of the domain properties over maps of the domain using
Stamen Maps. Below is how she did it:
Sunni recently asked about how to visualize output from WRF-Hydro over a domain.
The WRF-Hydro team maintains 3 Rwrfhydro vignettes links to them are located on our training web page. We do provide Rwrfhydro but do not maintain it regularly.
Sunni was able to modify VisualizeDomain.R and the calls to
VisualizeDomain.R in the Domain and Channel Visualization vignette to create plots of the domain properties over maps of the domain using
Stamen Maps. Below is how she did it:
" I learned that if the call to get_map has a certain form,
it defaults to a particular basemap source. This is why I had to modify
the call to VisualizeDomain.R in some cases.
See https://rdrr.io/cran/ggmap/man/get_map.html:
# lon-lat vectors automatically use google:
(map<- get_map <https://rdrr.io/cran/ggmap/man/get_map.html>(c <https://rdrr.io/r/base/c.html>(-97.14667, 31.5493)))
str <https://rdrr.io/r/utils/str.html>(map)
ggmap <https://rdrr.io/cran/ggmap/man/ggmap.html>(map)
# bounding boxes default to stamen
(map<- get_map <https://rdrr.io/cran/ggmap/man/get_map.html>(c <https://rdrr.io/r/base/c.html>(left= -97.1268, bottom= 31.536245, right= -97.099334, top= 31.559652)))
ggmap <https://rdrr.io/cran/ggmap/man/ggmap.html>(map)
# characters default to google
(map<- get_map <https://rdrr.io/cran/ggmap/man/get_map.html>("orlando, florida"))
ggmap <https://rdrr.io/cran/ggmap/man/ggmap.html>(map)
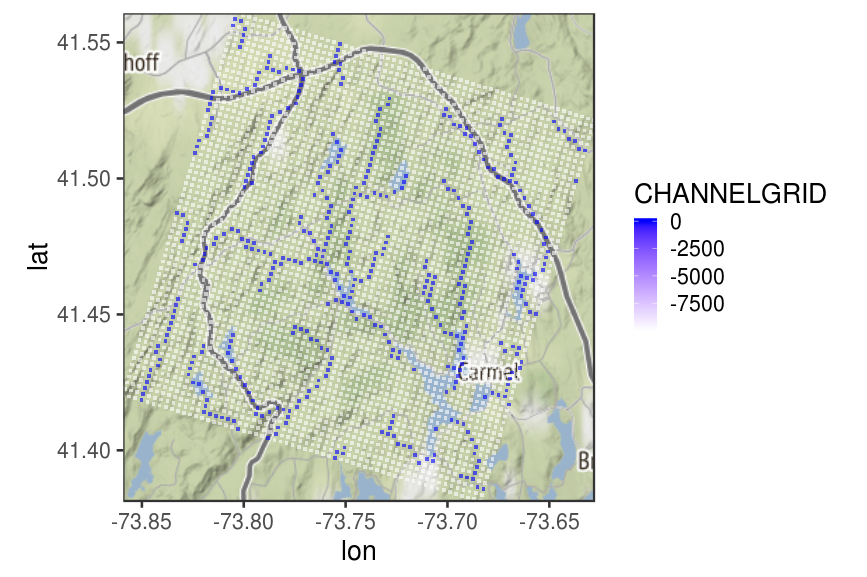
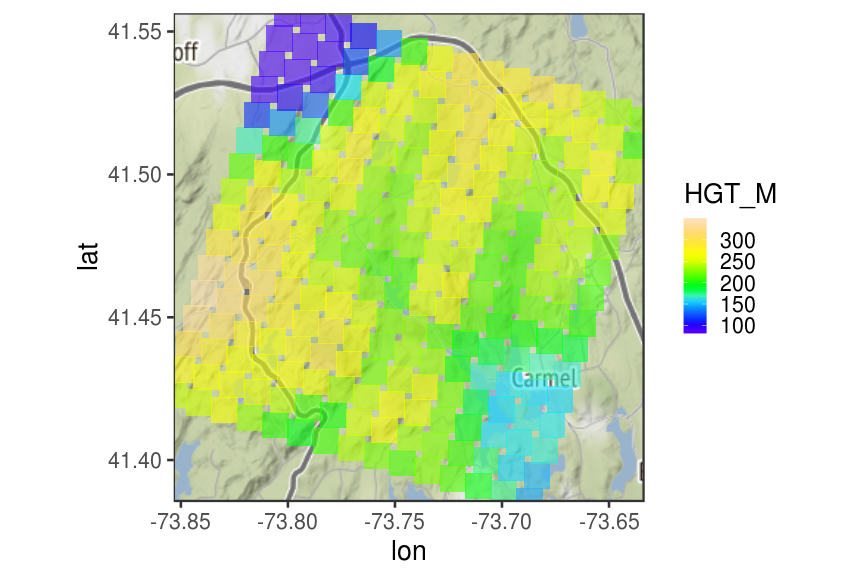
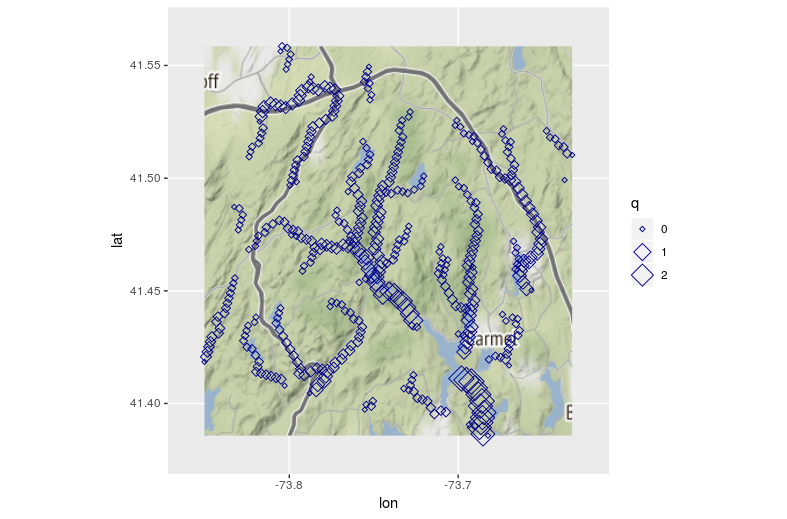
I also modified VisualizeChanNtwk.R to use Stamen Maps, and I was able
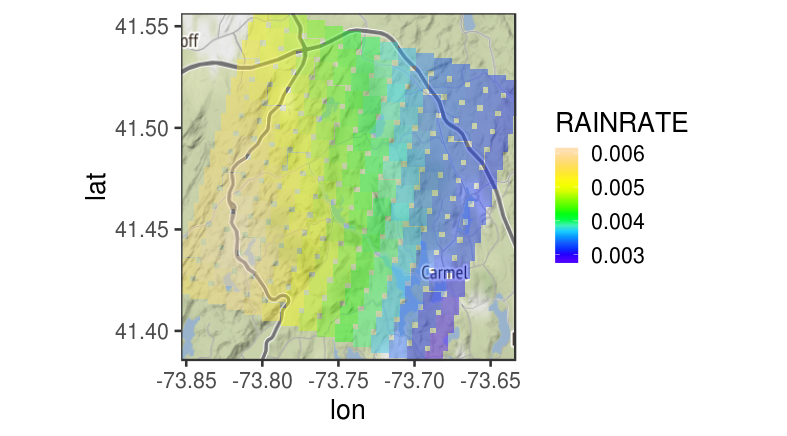
to plot simulated streamflow. Lastly, I made a new function based on
VisualizeDomain.R that uses data from the geogrid file and from a
YYYYMMDDHH.LDASIN_DOMAINx input file to plot precipitation at a given
time over a map of the domain. I will attach a few plots. I used the
Croton, NY test case. Please let me know if you would like additional
information. Since I am brand new to R, I can only imagine that there
may be more elegant ways to accomplish what I did."
it defaults to a particular basemap source. This is why I had to modify
the call to VisualizeDomain.R in some cases.
See https://rdrr.io/cran/ggmap/man/get_map.html:
# lon-lat vectors automatically use google:
(map<- get_map <https://rdrr.io/cran/ggmap/man/get_map.html>(c <https://rdrr.io/r/base/c.html>(-97.14667, 31.5493)))
str <https://rdrr.io/r/utils/str.html>(map)
ggmap <https://rdrr.io/cran/ggmap/man/ggmap.html>(map)
# bounding boxes default to stamen
(map<- get_map <https://rdrr.io/cran/ggmap/man/get_map.html>(c <https://rdrr.io/r/base/c.html>(left= -97.1268, bottom= 31.536245, right= -97.099334, top= 31.559652)))
ggmap <https://rdrr.io/cran/ggmap/man/ggmap.html>(map)
# characters default to google
(map<- get_map <https://rdrr.io/cran/ggmap/man/get_map.html>("orlando, florida"))
ggmap <https://rdrr.io/cran/ggmap/man/ggmap.html>(map)
I also modified VisualizeChanNtwk.R to use Stamen Maps, and I was able
to plot simulated streamflow. Lastly, I made a new function based on
VisualizeDomain.R that uses data from the geogrid file and from a
YYYYMMDDHH.LDASIN_DOMAINx input file to plot precipitation at a given
time over a map of the domain. I will attach a few plots. I used the
Croton, NY test case. Please let me know if you would like additional
information. Since I am brand new to R, I can only imagine that there
may be more elegant ways to accomplish what I did."
See the attached images.
How do other people visualize WRF-Hydro output over the domain?
How do other people visualize WRF-Hydro output over the domain?
Cheers,
Molly


Hicham Bmr
Jun 9, 2022, 1:12:39 PM6/9/22
to wrf-hydro_users, Molly
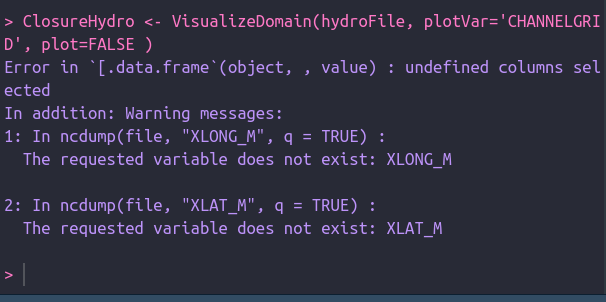
i have error to visualiz CHANNELGRID pleas help me
this is my error:
Le lundi 25 février 2019 à 21:21:18 UTC+1, Molly a écrit :
I am posting this on behalf of Sunni Siqueira Schoenauer (Sunni.Siq...@nrlssc.navy.mil) and also as it may spark some discussion.
Reply all
Reply to author
Forward
0 new messages